. 2008 Feb;36(2):423-34.
doi: 10.1093/nar/gkm1056. Epub 2007 Nov 26.

Transcription of Satellite III non-coding RNAs is a general stress response in human cells

Affiliations

Transcription of Satellite III non-coding RNAs is a general stress response in human cells

Rut Valgardsdottir et al. Nucleic Acids Res. 2008 Feb.

Abstract

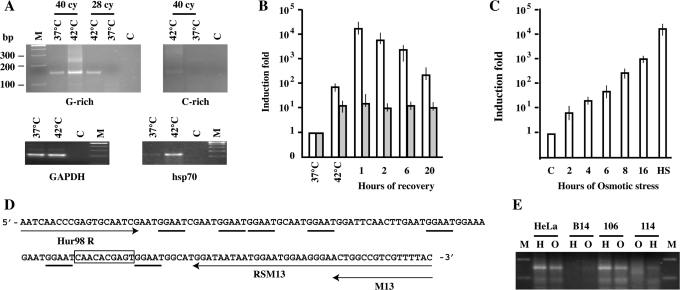
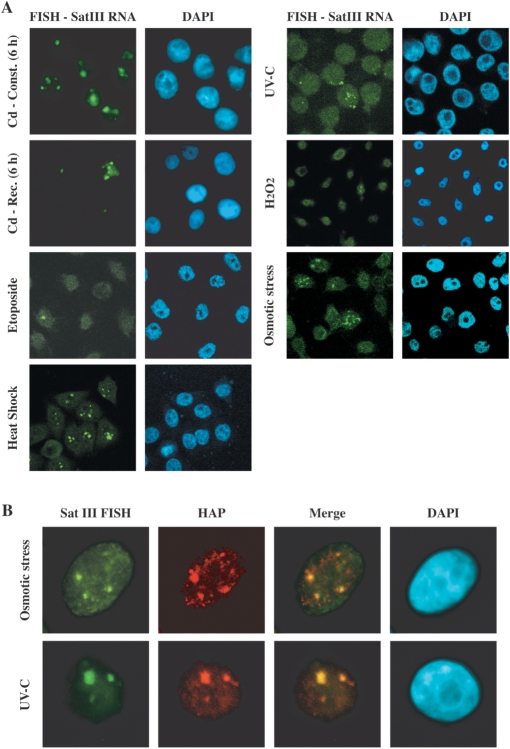
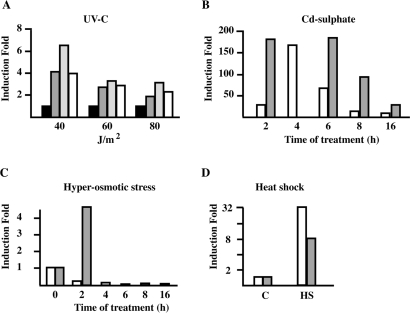
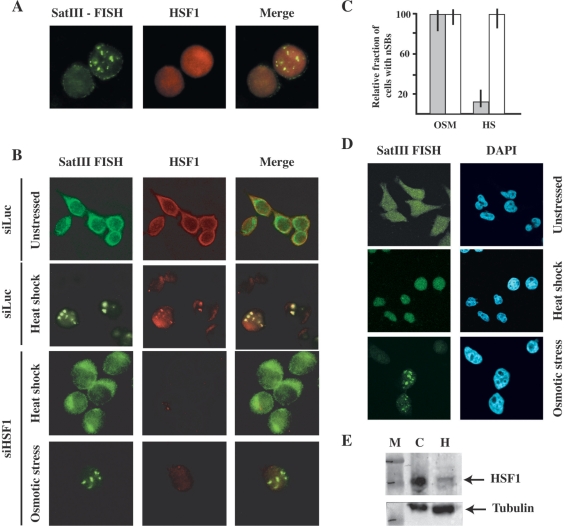
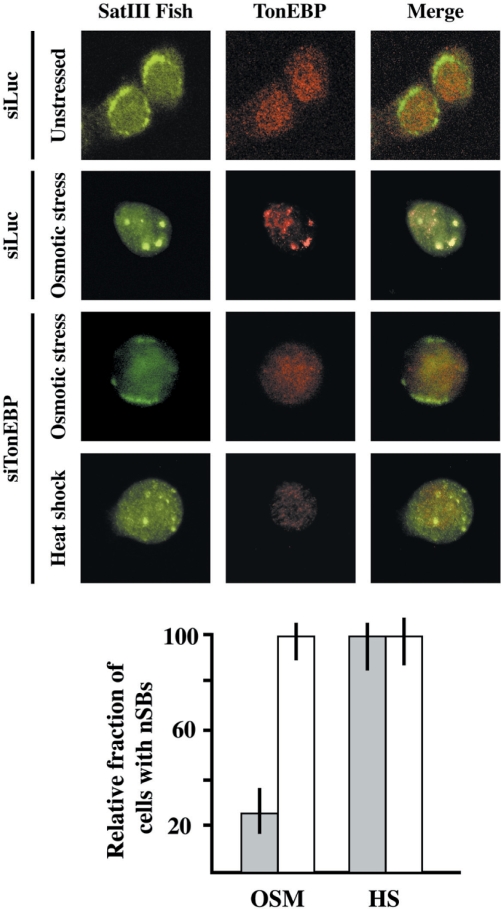
In heat-shocked human cells, heat shock factor 1 activates transcription of tandem arrays of repetitive Satellite III (SatIII) DNA in pericentromeric heterochromatin. Satellite III RNAs remain associated with sites of transcription in nuclear stress bodies (nSBs). Here we use real-time RT-PCR to study the expression of these genomic regions. Transcription is highly asymmetrical and most of the transcripts contain the G-rich strand of the repeat. A low level of G-rich RNAs is detectable in unstressed cells and a 10(4)-fold induction occurs after heat shock. G-rich RNAs are induced by a wide range of stress treatments including heavy metals, UV-C, oxidative and hyper-osmotic stress. Differences exist among stressing agents both for the kinetics and the extent of induction (>100- to 80.000-fold). In all cases, G-rich transcripts are associated with nSBs. On the contrary, C-rich transcripts are almost undetectable in unstressed cells and modestly increase after stress. Production of SatIII RNAs after hyper-osmotic stress depends on the Tonicity Element Binding Protein indicating that activation of the arrays is triggered by different transcription factors. This is the first example of a non-coding RNA whose transcription is controlled by different transcription factors under different growth conditions.


Figures

Figure 1.
Figure 1.
Expression of Satellite III RNAs. (A) RT-PCR analysis of SatIII transcripts in total RNA prepared from unstressed (37°C) and heat-shocked (1 h at 42°C followed by 2 h at 37°C) (42°C) HeLa cells. G-rich transcripts are reverse transcribed with the RSM13 primer and PCR amplified with Hur98R and M13 primers for 25 or 40 cycles. C-rich RNAs are reverse transcribed with FSM13 and amplified for 40 cycles with Hur98F and M13. The same amount of RNA (1 µg) was reverse transcribed with an oligo dT and amplified with oligos specific for GAPDH and hsp70.1 transcripts (see Supplementary Table 1). M: GeneRuler 100 bp DNA ladder plus (Fermentas) (B) qRT-PCR analysis of G-rich (white columns) and C-rich (gray columns) transcripts in total RNAs prepared from unstressed HeLa cells, from heat-shocked cells and from cells allowed to recover for the indicated times at 37°C. Primers used are the same described in panel A. Columns: mean of three independent experiments. Error bars are indicated. (C) qRT-PCR analysis of G-rich transcripts in total RNA prepared from HeLa cells subjected to Osmotic stress (0.8 M sorbitol) for the indicated times. Results were normalized against the housekeeping hP0 mRNA level and expressed as a function of the SatIII RNA level observed in unstressed control (C) cells. (HS): RNAs from HeLa cells kept 1 h at 42°C and allowed to recover 1 h at 37°C. Columns: mean of three independent experiments. Error bars are indicated. (D) Sequence of the amplified G-rich RNA in panel A (25 cy). Arrows: primers used in RT-PCR. GGAAT pentamers are underlined. The terminator sequence is boxed. (E) RT-PCR analysis of SatIII transcripts in total RNA prepared from HeLa, B14-150, GM-106 and GM-114 cell lines. For each cell lines we have analyzed RNA extracted from cells subjected to heat shock (H; 1h at 42°C followed by 1 h at 37°C) or to osmotic stress (8 h in 0.8 M sorbitol). G-rich transcripts were PCR amplified for 40 cycles.
Figure 2.
Figure 2.
In situ hybridization analysis of HeLa cells subjected to different stress treatments. Stressed cells were hybridized to a biotinylated probe complementary to the G-rich strand of the SatIII repeat (A) HeLa cells were subjected to the indicated stress treatments (details in Materials and Methods section). Cd-Const (6 h): treatment with 5 µM Cadmium-sulfate for 6 h. Cd-Rec (6 h): cadmium for 1 h and then fresh medium for 6 h. Etoposide: 100 µM for 2 h. Heat shock: 1 h at 42°C followed by 1 h at 37°C. UV-C: 40 J/m2 followed by 8 h of recovery. Osmotic stress: HeLa cells grown 8 h in 0.8 M sorbitol. Oxidative stress: HeLa cells grown 20 min in 200 µM H2O2 followed by 16 h of recovery. (B) UV-C and hyper-osmotic stress induce nSBs. HeLa cells were subjected to hyper-osmotic stress (8 h in 0.8 M sorbitol) or UV-C irradiated (40 J/m2) and allowed to recover for 16 h. Cells were analyzed by in situ hybridization with a biotinylated probe complementary to the G-rich strand of the SatIII repeat and co-stained with an antibody against hnRNP HAP/Saf-B. Confocal images of the same cells were taken and merged.
Figure 3.
Figure 3.
Different SatIII chromosomal domains are activated by osmotic stress. (A) The number of nSBs per cell has been measured. Cells have been grouped in four classes containing the indicated number of nSBs. Percentages have been calculated on 300 cells with nSBs in three different experiments. White columns: Cells grown for 8 h in 0.8 M Sorbitol. Gray columns: 1 h at 42°C followed by 1 h at 37°C. (B) Parental B14-150 cells, and somatic human>hamster cell hybrids GM-106, GM-114 and YXY-95S grown 8 h in 0.8 M sorbitol, heat shocked (1 h at 42°C followed by 1 h at 37°C) or untreated (NT). Cells were analyzed by RNA in situ hybridization (FISH) and co-stained with DAPI. Confocal images of the same cells are shown. (C) qRT-PCR analysis of G-rich SatIII RNAs extracted from the indicated cells lines untreated (C), heat shocked (HS) or grown for the indicated hours in 0.8 M sorbitol. RNAs were first standardized by measuring by qRT-PCR the level of the GAPDH transcripts. The induction fold has been calculated using the level of SatIII RNAs in unstressed cells as reference. Dots represent the results of a second experiment. ND: non detectable.
Figure 4.
Figure 4.
Quantitative RT-PCR analysis of hsp70.1 mRNA level in HeLa cells subjected to different stress treatments. (A) Total RNA (1 µg) from HeLa cells irradiated with UV-C at the indicated doses was reverse transcribed with oligo dT. An aliquot (1/10th) was tested in qPCR to assess the level of hsp70 A1A mRNA. Black bars: no recovery. Dark gray bars: 4 h of recovery. Light gray bars: 8 h of recovery. White bars: 15 h of recovery after irradiation. (B) HeLa cells were treated with 5 µM cadmium sulfate for 1 h and allowed to recover for the indicated times (white bars). Gray bars: cell treated for the indicated times with 5 µM cadmium sulfate. (C) HeLa cells were grown for the indicated time periods in 0.8 M sorbitol. White columns: hsp70.1. Gray columns: hsp70.2. (D) HeLa cells heat shocked 1 h at 42°C and the allowed to recover 1 h at 37°C (HS). White columns: hsp70.1. Gray columns: hsp70.2. C represents unstressed cells.
Figure 5.
Figure 5.
Effect of osmotic stress on HSF1. (A) Western blot analysis of total cell extracts prepared from unstressed HeLa cells (C), from heat-shocked cells and from cells subjected to osmotic stress (0.8 M sorbitol) for the indicated time periods. Extracts were analyzed with an antibody to HSF1 and normalized for the level of α-tubulin. The phosphorylated and un-phosphorylated forms of HSF1 are indicated. (B) HeLa cells either unstressed (C) or grown for the indicated time periods in 0.8 M sorbitol were co-stained with DAPI, with an oligo specific for G-rich SatIII RNAs and with an antibody against HSF1. Confocal images of the same cells are shown.
Figure 6.
Figure 6.
HSF1 is dispensable for expression of SatIII RNAs after hyper-osmotic stress. (A) HSF1 does not colocalize with SatIII RNAs in HeLa cells after hyper-osmotic stress. HeLa cells were treated for 8 h with 0.8 M sorbitol and then co-stained with an anti-HSF1 antibody and with a biotinylated probe complementary to the G-rich strand of the SatIII repeat. Confocal images of the same cell are shown. (B) HeLa cells were transfected with an siRNA against HSF1. After two rounds of transfection, the cell population was split in two pools, one subjected to heat shock (45 min at 42°C) the other to hyper-osmotic stress (8 h in 0.8 M sorbitol). Cells were then co-stained with an anti HSF1 antibody and with a biotinylated probe complementary to the G-rich strand of the SatIII repeat. Confocal images of the same cells are shown. As a control cells were transfected with an anti-luciferase siRNA and analyzed either before or after heat shock. (C) The histogram represents the fraction of cells with SatIII RNAs in nSBs after heat shock (HS) or hyper-osmotic stress (OSM). Gray bars: cells transfected with the anti-HSF1 siRNA. White bars: cells transfected with the anti-luciferase siRNAs. Values are calculated on three independent experiments and are expressed as percentages of the fraction of control non-transfected cells displaying nSBs. Error bars are indicated. (D) Analysis of HeLa-HSF1i cells in which HSF1 level is reduced through stable expression of a specific siRNA. Cells were costained with DAPI and with a biotinylated oligo specific for G-rich SatIII molecules. Confocal images of the same cells are shown. (E) Western blot analysis of total cell extract prepared for HeLa cells (C) and from HeLa-HSF1i cells that stably express the siRNA against HSF1 (H). Western blots were analyzed with antibodies directed against HSF1 and α-tubulin. M: Biorad MW markers.
Figure 7.
Figure 7.
TonEBP is required for expression of SatIII RNAs after hyper-osmotic stress. HeLa cells were transfected with an siRNA against TonEBP. After two rounds of transfection the cell population was split in two pools, one subjected to heat shock (45 min at 42°C) the other to hyper-osmotic stress (8 h in 0.8 M sorbitol). Cells were then co-stained with an anti TonEBP antibody and with a biotinylated probe complementary to the G-rich strand of the SatIII repeat. Confocal images of the same cells are shown. As a control cells transfected with an anti-luciferase siRNA were subjected to hyper-osmotic stress. The histogram represents the fraction of cells with SatIII RNAs in nSBs after heat shock (HS) or hyper-osmotic stress (OSM). Gray bars: cells transfected with the anti-TonEBP siRNA. White bars: cells transfected with the anti-luciferase siRNAs. Values are calculated on three independent experiments and are expressed as percentages of the fraction of control non-transfected cells displaying nSBs.

References

    1. Morimoto RI, Sarge KD, Abravaya K. Transcriptional regulation of heat shock genes. A paradigm for inducible genomic responses. J. Biol. Chem. 1992;267:21987–21990. - PubMed
    1. Pirkkala L, Nykanen P, Sistonen L. Roles of the heat shock transcription factors in regulation of the heat shock response and beyond. Faseb J. 2001;15:1118–1131. - PubMed
    1. Herr I, Debatin KM. Cellular stress response and apoptosis in cancer therapy. Blood. 2001;98:2603–2614. - PubMed
    1. Morimoto RI. Cells in stress: transcriptional activation of heat shock genes. Science. 1993;259:1409–1410. - PubMed
    1. Mathew A, Mathur SK, Jolly C, Fox SG, Kim S, Morimoto RI. Stress-specific activation and repression of heat shock factors 1 and 2. Mol. Cell. Biol. 2001;21:7163–7171. - PMC - PubMed

Publication types

MeSH terms