. 2008 Feb;28(3):1047-60.
doi: 10.1128/MCB.01622-07. Epub 2007 Nov 26.

A stage-specific factor confers Fab-7 boundary activity during early embryogenesis in Drosophila

Affiliations

A stage-specific factor confers Fab-7 boundary activity during early embryogenesis in Drosophila

Tsutomu Aoki et al. Mol Cell Biol. 2008 Feb.

Abstract

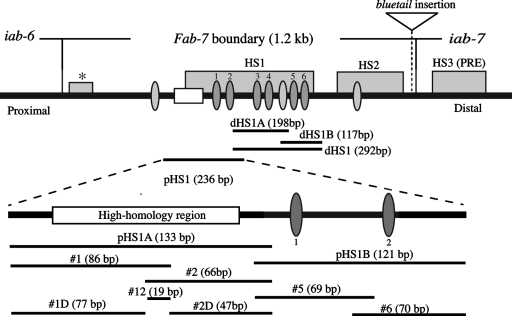
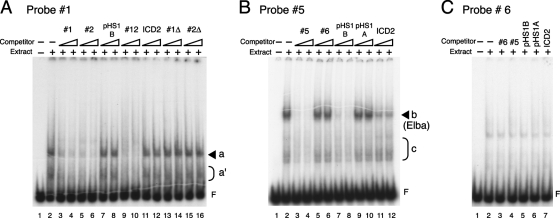
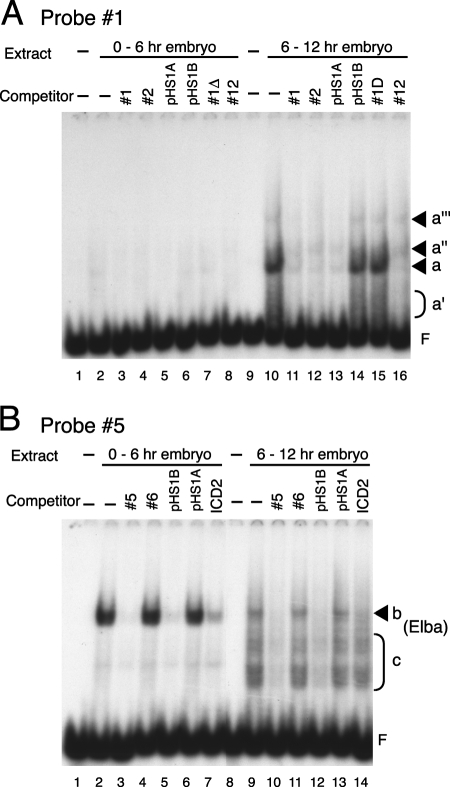
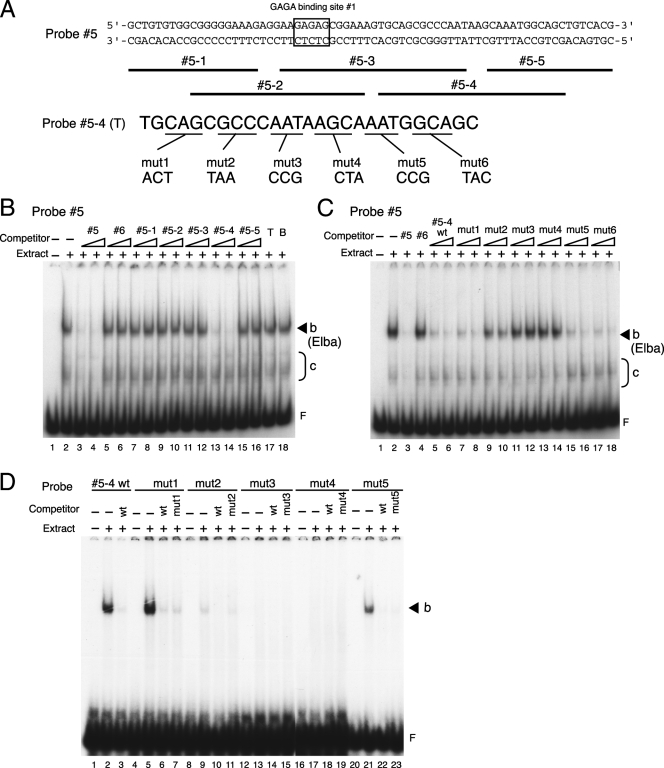
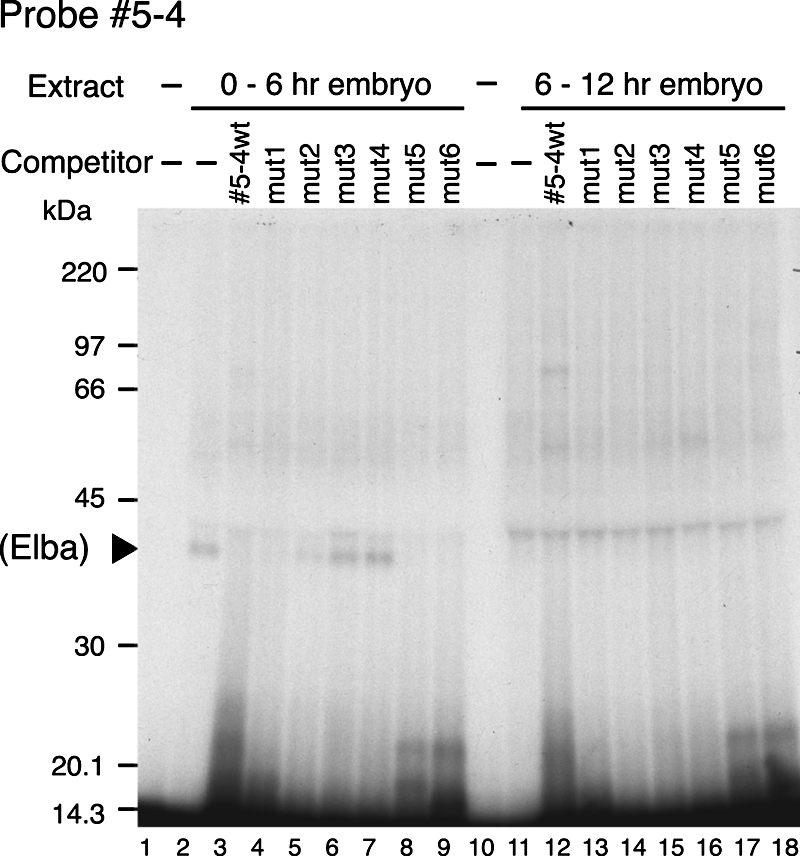
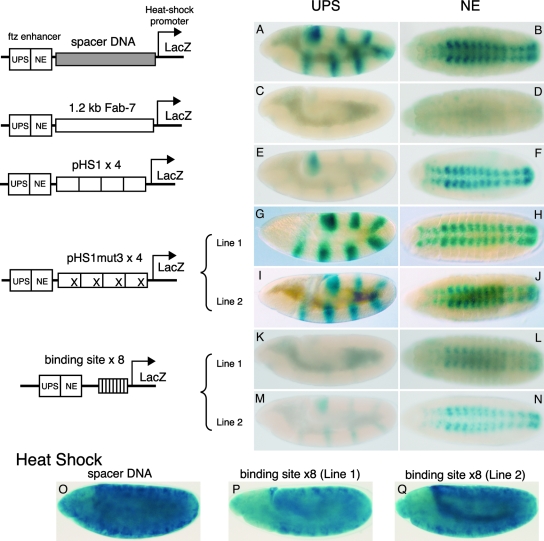
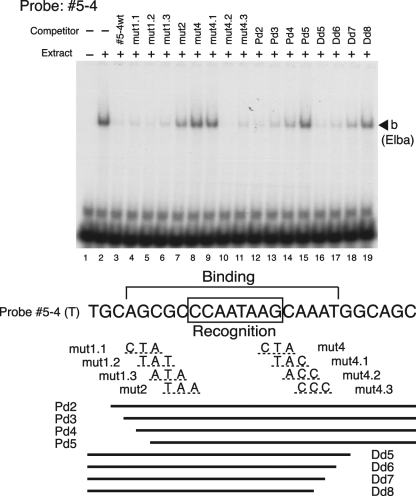
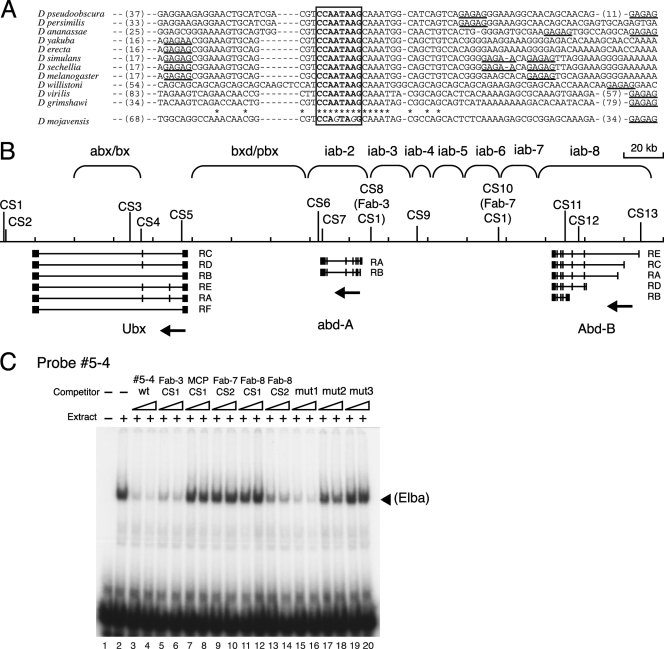
The Fab-7 boundary is required to ensure that the iab-6 and iab-7 cis-regulatory domains in the Drosophila Bithorax complex can function autonomously. Though Fab-7 functions as a boundary from early embryogenesis through to the adult stage, this constitutive boundary activity depends on subelements whose activity is developmentally restricted. In the studies reported here, we have identified a factor, called early boundary activity (Elba), that confers Fab-7 boundary activity during early embryogenesis. The Elba factor binds to a recognition sequence within a Fab-7 subelement that has enhancer-blocking activity during early embryogenesis, but not during mid-embryogenesis or in the adult. We found that the Elba factor is present in early embryos but largely disappears during mid-embryogenesis. We show that mutations in the Elba recognition sequence that eliminate Elba binding in nuclear extracts disrupt the early boundary activity of the Fab-7 subelement. Conversely, we find that early boundary activity can be reconstituted by multimerizing the Elba recognition site.


Figures

FIG. 1.
FIG. 1.
Map of the Fab-7 region and the probes used for EMSA. A schematic structure of the D. melanogaster Fab-7 region is shown at the top. Four DNase I-hypersensitive regions, HS1, HS2, HS3, and the minor region (asterisked), are shown as shaded boxes. The open box represents a 93-bp “high”-homology region that is conserved among Drosophila species. The binding sites for GAGA factor (Trithorax-like) are shown as dark (GAGAG) or light (GAGAA) shaded ovals. The structure of the pHS1 region is shown enlarged below. The name and location of each of the probes from pHS1 used in EMSA are given at the bottom.
FIG. 2.
FIG. 2.
Multiple binding activities to the pHS1 region are observed in 0- to 12-h embryo extracts by EMSA. (A) EMSA with labeled probe 1. Probe 1 DNA was 5′ end labeled with 32P and incubated with (lanes 2 to 16) or without (lane 1) 15 μg (protein amount) of nuclear extracts derived from 0- to 12-h embryos in the absence (lanes 1 and 2) or presence (lanes 3 to 16) of unlabeled cold competitor probes as indicated above the lanes. The competitor ICD2 is an 87-bp fragment from Fab-8, used as a heterologous control DNA. Either a 50-fold (left lane of each set) or a 100-fold (right lane of each set) excess of the cold competitor was added to the reaction mixture. After a 30-min incubation at room temperature, the samples were electrophoresed on a 4% acrylamide-0.5× TBE-2.5% glycerol gel. The identity of the shifted band is indicated by a solid arrowhead or half-parentheses on the right. The letter F represents the position of “free”’ (unbound) probe. (B) EMSA with probe 5. End-labeled probe 5 DNA was incubated with (lanes 2 to 12) or without (lane 1) 15 μg (protein amount) of nuclear extracts from 0- to 12-h embryos in the absence (lanes 1 and 2) or presence (lanes 3 to 12) of competitor probes as indicated. Other EMSA experimental conditions were the same as those described for panel A. The free probe and the identities of shifted bands are indicated as described for panel A. (C) EMSA with probe 6. Probe 6 was incubated with (lanes 2 to 7) or without (lane 1) 15 μg (protein amount) of nuclear extracts from 0- to 12-h embryos in the absence (lanes 1 and 2) or presence (lanes 3 to 7) of the competitor probes indicated. A 100-fold excess of unlabeled DNA was used for each competition.
FIG. 3.
FIG. 3.
pHS1-binding activities change during embryonic development. Nuclear extracts were prepared from 0- to 6-h embryos or 6- to 12-h embryos and used in EMSA experiments as described in the legend to Fig. 2. (A) DNA binding proteins recognizing probe 1 are enriched in nuclear extracts from 6- to 12-h embryos. Nuclear extracts (15 μg protein) derived from 0- to 6-h embryos (lanes 2 to 8) or 6- to 12-h embryos (lanes 10 to 16), or buffer only (lanes 1 and 9), were incubated with labeled probe 1 in the absence (lanes 1, 2, 9, and 10) or presence (lanes 3 to 8 and 11 to 16) of a 100-fold excess of cold competitor DNA (indicated above each lane). Positions of shifted bands or free probe are shown as described for Fig. 2. (B) High levels of binding activity b are found in nuclear extracts from 0- to 6-h embryos, while only residual amounts of this activity are evident in nuclear extracts from 6- to 12-h embryos. Nuclear extracts (15 μg of protein) from 0- to 6-h embryos (lanes 2 to 7) or 6- to 12-h embryos (lanes 9 to 14), or buffer only (lanes 1 and 8), were incubated with labeled probe 5 in the absence (lanes 1, 2, 8, and 9) or presence (lanes 3 to 7 and 10 to 14) of a 100-fold excess of cold competitor DNA (indicated above the lanes). Positions of shifted bands or free probe are shown as described for Fig. 2.
FIG. 4.
FIG. 4.
Localization of the binding sequence for activity b. (A) Probes used for mapping the binding sequence for activity b. The sequences of both strands of probe 5 are shown at the top. Binding site 1 for GAGA factor is boxed. The positions of the overlapping smaller DNAs 5-1 to 5-5 are indicated by lines below the probe 5 sequence. For the 3-base mutations in probe 5-4, the “top”-strand (5′ [proximal] to 3′ [distal]) sequence of DNA 5-4 [5-4(T)] and the corresponding bases of mutations in mutant probes are shown. Each base alteration was introduced so that a purine was converted to a pyrimidine and A/T and C/G were interconverted. (B) Activity b recognizes sequences included in the 5-4 region of probe 5. The EMSA experiment was performed as described for Fig. 2B except that DNA subfragments spanning probe 5 were used as cold competitors. End-labeled probe 5 DNA was incubated with (lanes 2 to 16) or without (lane 1) 15 μg (protein) of nuclear extracts derived from 0- to 12-h embryos in the absence (lanes 1 and 2) or presence (lanes 3 to 18) of cold competitor DNAs (given above the lanes). Either a 50-fold (left lane of each set) or a 100-fold (right lane of each set) excess of cold competitor DNA (lanes 3 to 16) was used for the competition experiments. The competitor used in lanes 17 and 18 was a 100-fold excess of single-strand 5-4 DNA. T and B represent the “top” strand (5′ [proximal] to 3′ [distal]) and the “bottom” strand (5′ [distal] to 3′ [proximal]) of DNA 5-4, respectively. The positions of the band for activity b and the free probe are indicated by a solid arrowhead and the letter F, respectively. (C) Mapping of bases critical for the binding of activity b. The EMSA experiment was performed as described for panel B except that 5-4 DNA fragments containing different 3-base mutations were used as the cold competitors. Labeled probe 5 was incubated with (lanes 2 to 18) or without (lane 1) 15 μg (protein) of nuclear extracts from 0- to 12-h embryos in the absence (lanes 1 and 2) or presence (lanes 3 to 18) of unlabeled competitor probes (given above the lanes). Either a 50-fold (left lane of each set) or a 100-fold (right lane of each set) excess of unlabeled DNA (lanes 3 to 18) was used for each competition. 5-4 wt, wild-type 5-4 probe; mut1, the 5-4 probe with mutation 1, which has the 3-base alteration in the 5-4 sequence shown in panel A. (D) EMSA with mutant probes support the results of the competition experiments. 5-4 wt and mut1 to mut5 were end labeled and used in the EMSA experiments as described above. The labeled probes are shown above the lanes. Nuclear extracts of 15 μg (protein) from 0- to 12-h embryos were used except in lanes 1, 4, 8, 12, 16, and 20. In the competition experiments with wild-type or mutant 5-4 DNAs, a 100-fold excess of unlabeled DNA was used as indicated above the individual lanes.
FIG. 5.
FIG. 5.
A 40-kDa protein in nuclear extracts from 0- to 6-h embryos is UV cross-linked to probe 5-4. End-labeled probe 5-4 was incubated with nuclear extracts from 0- to 6-h embryos (lanes 2 to 9) or 6- to 12-h embryos (lanes 11 to 18), or with buffer only (lanes 1 and 10), under the same conditions as those used for EMSA except that a lower concentration of poly(dI-dC) was used. After a 30-min incubation at room temperature, the samples were treated with UV light (using a UV cross-linker) for 10 min and then analyzed on a 10% acrylamide-SDS gel. Competition experiments using either wild-type (wt) or mutant 5-4 probes (lanes 3 to 9 and 12 to 18) were performed as described for the EMSA experiments in Fig. 4C. The positions of size markers and the ∼40-kDa band (solid arrowhead) are indicated on the left.
FIG. 6.
FIG. 6.
DNA-binding activity b is necessary and sufficient for the stage-specific boundary activity of pHS1. (A to N) LacZ expression in embryos of representative lines homozygous for transgenes that have different DNA fragments placed between the ftz enhancers and the hsp70 promoter-LacZ reporter. The schematic structure of each transgene is shown on the left. (A, C, E, G, I, K, and M) Images of germ band-extended embryos. Although the UPS enhancer activates stripe expression earlier in development, this is when the highest levels of UPS enhancer-dependent β-galactosidase accumulation are typically observed. (B, D, F, H, J, L, and N) Images of germ band-retracted-stage embryos. Again, though NE-dependent CNS expression comes on earlier, this is when the highest levels of β-galactosidase accumulation from the ftz NE enhancer are observed. (A and B) Nonspecific DNA fragment; (C and D) 1.2-kb (full-length) Fab-7 boundary; (E and F) 4 copies of the pHS1 fragment; (G through J) 4 copies of pHS1 with mutation 3 in line 1 (G and H) and line 2 (I and J); (K through N) 8 copies of the Elba-binding site in line 1 (K and L) and line 2 (M and N). (O to Q) Reporter genes are not silenced in the “Elba binding site ×8” lines. These two lines, as well as a control “spacer DNA”’ line, were treated at 37°C for 1 h to induce LacZ expression from the heat shock promoter. The staining was stopped sooner than for panels A to N. Germ band-extended embryos are shown for each line.
FIG. 7.
FIG. 7.
Mapping of the Elba recognition sequence in probe 5-4. Labeled 5-4 DNA was incubated with nuclear extracts from 0- to 12-h embryos in the presence of a 100-fold excess of cold competitor DNA as indicated. DNAs used as cold competitors are diagramed below. The sequence for the top (T) strand (5′ [proximal] to 3′ [distal]) of probe 5-4 is shown. For 3-bp mutations, the changes in the DNA sequence are given below the corresponding bases of 5-4. The rule for changing bases was the same as that described in the legend to Fig. 4. Bold lines delineate the positions of the truncated DNAs. The 8-bp core recognition sequence and the flanking sequences in the top strand of probe 5-4 that contribute to efficient binding in the EMSA experiment are bracketed.
FIG. 8.
FIG. 8.
The Elba recognition sequence is conserved in other Drosophila species and is present elsewhere in D. melanogaster BX-C. (A) The Elba recognition sequence is conserved in the Fab-7 boundaries of other Drosophila species. The Fab-7 sequences of D. melanogaster and 11 other Drosophila species, available at www.flybase.org, were collected and piled up with the ClustalW program to align the high-homology region conserved among the species. To refine the alignment in the region containing the Elba recognition sequence, a smaller DNA sequence of 120 to 150 bp was piled up again. This procedure aligned the 8-bp Elba recognition sequence (boldfaced and boxed) better in the different species. Only a part of the aligned Fab-7 sequence is shown. The sequence of the putative Elba site in D. mojavensis, which differs in 2 bases (italicized) from that of D. melanogaster, is at the bottom. The bases conserved among the other 11 species are asterisked. The number in parentheses on the left of each sequence represents the distance (in bases) from the “high”-homology region of each sequence. Numbers elsewhere are the numbers of bases omitted in the sequence. Potential binding sites for the GAGA factor (Trithorax-like) are underlined. (B) Distribution of Elba consensus sequences in the BX-C region. About 330 kb of the bithorax complex region is shown as a horizontal line in the center. The cis-regulatory regions of BX-C are indicated on the top. Positions of 13 matches (CS) to the 8-bp core sequence in pHS1 are indicated above the horizontal line. CS10 (Fab-7 CS1) is the Elba recognition sequence in Fab-7. At the bottom, the three homeotic transcription units in BX-C are represented by combinations of thin lines (introns) and thick lines (exons). The arrow indicates the orientation of each transcription. (C) Elba can also bind to sites in Fab-3 and Fab-8. Several of the potential Elba recognition sites (precise matches and sites that differ at a single base) in BX-C were tested in EMSA competition experiments as described for preceding figures. Labeled probe 5-4 was incubated with (lanes 2 to 20) or without (lane 1) 15 μg of 0- to 12-h nuclear extracts in the absence (lanes 1 and 2) or presence (lanes 3 to 20) of the competitor DNAs indicated. The conditions of EMSA experiments were same as those described in Fig. 2. Either a 50-fold (left lane of each set) or a 100-fold (right lane of each set) excess of cold DNA was used in the competition experiments. Fab-3 CS1 (CS8) has a precise match to the 8-bp core recognition sequence in pHS1. Other competitors are probes from known BX-C boundaries that have sequences resembling the Elba 8-bp core recognition sequence in pHS1. Their sequences are as follows: MCP CS1, TCAATAAG; Fab-7 CS2, CCAAAAAG; Fab-8 CS1, CCAATATG; Fab-8 CS2, ACAATAAG. The three mutant probes from Fig. 4C, mut1, mut2, and mut3, were also tested for comparison with the different BX-C probes.

References

    1. Akbari, O. S., A. Bousum, E. Bae, and R. A. Drewell. 2006. Unraveling cis-regulatory mechanisms at the abdominal-A and Abdominal-B genes in the Drosophila bithorax complex. Dev. Biol. 293294-304. - PubMed
    1. Bell, A. C., A. G. West, and G. Felsenfeld. 1999. The protein CTCF is required for the enhancer blocking activity of vertebrate insulators. Cell 98387-396. - PubMed
    1. Chung, J. H., A. C. Bell, and G. Felsenfeld. 1997. Characterization of the chicken beta-globin insulator. Proc. Natl. Acad. Sci. USA 94575-580. - PMC - PubMed
    1. Galloni, M., H. Gyurkovics, P. Schedl, and F. Karch. 1993. The bluetail transposon: evidence for independent cis-regulatory domains and domain boundaries in the bithorax complex. EMBO J. 121087-1097. - PMC - PubMed
    1. Gaszner, M., and G. Felsenfeld. 2006. Insulators: exploiting transcriptional and epigenetic mechanisms. Nat. Rev. Genet. 7703-713. - PubMed

Publication types

LinkOut - more resources