. 2007 Nov;177(3):1277-90.
doi: 10.1534/genetics.107.075069.

Analysis of Drosophila species genome size and satellite DNA content reveals significant differences among strains as well as between species

Affiliations

Analysis of Drosophila species genome size and satellite DNA content reveals significant differences among strains as well as between species

Giovanni Bosco et al. Genetics. 2007 Nov.

Abstract

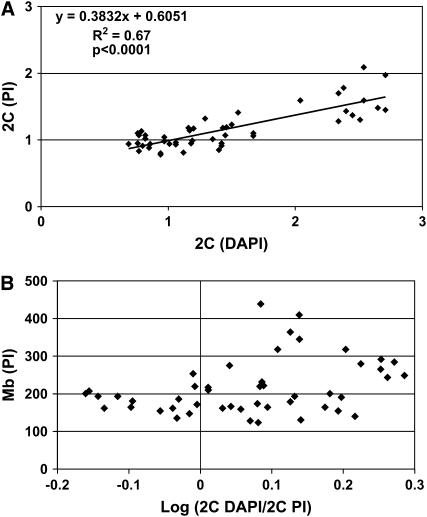
The size of eukaryotic genomes can vary by several orders of magnitude, yet genome size does not correlate with the number of genes nor with the size or complexity of the organism. Although "whole"-genome sequences, such as those now available for 12 Drosophila species, provide information about euchromatic DNA content, they cannot give an accurate estimate of genome sizes that include heterochromatin or repetitive DNA content. Moreover, genome sequences typically represent only one strain or isolate of a single species that does not reflect intraspecies variation. To more accurately estimate whole-genome DNA content and compare these estimates to newly assembled genomes, we used flow cytometry to measure the 2C genome values, relative to Drosophila melanogaster. We estimated genome sizes for the 12 sequenced Drosophila species as well as 91 different strains of 38 species of Drosophilidae. Significant differences in intra- and interspecific 2C genome values exist within the Drosophilidae. Furthermore, by measuring polyploid 16C ovarian follicle cell underreplication we estimated the amount of satellite DNA in each of these species. We found a strong correlation between genome size and amount of satellite underreplication. Addition and loss of heterochromatin satellite repeat elements appear to have made major contributions to the large differences in genome size observed in the Drosophilidae.


Figures

F<sc>igure</sc> 1.—
Figure 1.—
Drosophila polyploid follicle cells underreplicate satellite DNA repeats. Proliferating follicle cells duplicate their entire genomes and cycle from 2C to 4C and after mitotic division back to 2C (A). 2C cells enter their polyploid state by replicating their euchromatic sequences and replicate little or no centric/pericentric satellite repeat sequences (B). Consequently, 4c-p cells have less 4C DNA content, and a second and third round of polyploid S-phases produce 16C cells with vastly underreplicated satellite DNA. Flow cytometry histograms of follicle cell nuclei from (C) D. melanogaster, (D) D. grimshawi, (E) D. immigrans, and (F) D. virilis are shown by illustrating the four major 2C, 4C, 8C, and 16C ploidy peaks where the x-axis represents arbitrary fluorescent units and the y-axis is the number of nuclei. Note that the 4C peak can be resolved into two peaks (see insets in C and F), where the 4C peak from mitotic proliferating cells has more DNA content than the 4C-p peak. This is because follicle cells undergoing polyploidization fail to replicate the centric and pericentric satellite repeats and thus have less DNA than mitotic 4C cells, as described in A. In larger genomes such as (D) D. grimshawi, (E) D. immigrans and (F) D. virilis, the extent of underreplication can be seen by a dramatic shift of all polyploid peaks to the left. The most extreme example is seen in (F) D. virilis where the 8C peak nearly overlaps the normal mitotic cell 4C peak (see inset), suggesting that about half of the genome fails to replicate. This is consistent with measurements of ∼48% heterochromatin content in D. virilis (see Table 5). We observed underreplication in all 91 strains from all 38 species that we examined.
F<sc>igure</sc> 2.—
Figure 2.—
DAPI measurements overestimate DNA content. (A) 2C values relative to D.m. yw control for DAPI (x-axis) were plotted against their corresponding 2C values for PI (y-axis). A trend line was fit to ascertain how DAPI values change relative to PI values. A slope that is <1 shows that DAPI values increase at a greater rate than PI values. This indicates that as genomes become larger DAPI overestimates DNA content (see text for details) and thus must be corrected. A two-tailed P-value was calculated from the correlation coefficient (R) and 45 degrees of freedom (d.f.) using Graphpad software. (B) DAPI fluorescence has a A:T bias whereas PI does not. The 2C DAPI/2C PI ratio values for each strain reflect the overall A:T/G:C content of each genome. The log (2C DAPI/2C PI) values (x-axis) and the corresponding haploid genome size (y-axis) values, as determined by PI 2C, are shown. Note that these measurements are for total genomic A:T/G:C content and may differ substantially from estimates of euchromatic A:T/G:C sequence content.
F<sc>igure</sc> 3.—
Figure 3.—
The 16C/2C ratios are inversely proportional to 2C values. 16C/2C ratios were compared to their corresponding 2C values for PI (A) and DAPI (B) values. In each case, 16C/2C values decrease as genomes increase in size, indicating that a larger fraction of the genome is being underreplicated. A two-tailed P-value was calculated from the correlation coefficient (R) using Graphpad software. PI values (A) had 45 d.f. and DAPI values (B) had 90 d.f.
F<sc>igure</sc> 4.—
Figure 4.—
Chromocenter size reflects satellite content. Stage 13 follicle cell nuclei were stained with DAPI (A, D, and G) and with antidimethyl histone H3 (B, E, and H). Chromocenters (arrows) stain as a bright DAPI dot within the nucleus and are enriched for lysine-9 dimethyl H3. The merged images (C, F, and I) show colocalization of DAPI and lysine-9 dimethyl H3. Bars, 10 μm. The area from each chromocenter was measured and normalized for nuclear area (J). Both DAPI (solid bars) and lysine-9 dimethyl H3 (shaded bars) area measurements show that, compared to D. melanogaster, D. virilis chromocenters are significantly larger (P < 0.0001) whereas C. pararufithorax has significantly smaller chromocenters (P < 0.0001). Standard error bars are shown and values represent averages from 35 cells (see materials and methods).
F<sc>igure</sc> 5.—
Figure 5.—
Larger genomes have greater underreplication. The percentage of underreplication (y-axis) was calculated on the basis of 16C/2C values (see materials and methods) and is shown plotted against haploid genome size in megabases, as determined by PI (A) and DAPI (B) flow cytometry. A trend line was added to show that, as genomes become larger, a greater fraction of the total DNA content is underreplicated. Note that the same trend is observed regardless of the dye used. Two-tailed P-values were calculated as in Figure 3.

References

    1. Allshire, R., 2002. Molecular biology. RNAi and heterochromatin—a hushed-up affair. Science 297: 1818–1819. - PubMed
    1. Ashburner, M., and G. K. Golic and R. S. Hawley, 2005. Drosophila: A Laboratory Handbook. Cold Spring Harbor Laboratory Press, Cold Spring Harbor, NY.
    1. Becker, H. J., 1977. Heterochromatin of the Drosophila melanogaster Y chromosome as modifier of position effect variegation: the time of its action. Mol. Gen. Genet. 151: 111–114. - PubMed
    1. Belyakin, S. N., G. K. Christophides, A. A. Alekseyenko, E. V. Kriventseva, E. S. Belyaeva et al., 2005. Genomic analysis of Drosophila chromosome underreplication reveals a link between replication control and transcriptional territories. Proc. Natl. Acad. Sci. USA 102: 8269–8274. - PMC - PubMed
    1. Bennett, M. D., I. J. Leitch, H. J. Price and J. S. Johnston, 2003. Comparisons with Caenorhabditis (approximately 100 Mb) and Drosophila (approximately 175 Mb) using flow cytometry show genome size in Arabidopsis to be approximately 157 Mb and thus approximately 25% larger than the Arabidopsis genome initiative estimate of approximately 125 Mb. Ann. Bot. 91: 547–557. - PMC - PubMed

Publication types

LinkOut - more resources