. 2007 Dec 3;179(5):1059-66.
doi: 10.1083/jcb.200708206. Epub 2007 Nov 26.

In vivo visualization of type II plasmid segregation: bacterial actin filaments pushing plasmids

Affiliations

In vivo visualization of type II plasmid segregation: bacterial actin filaments pushing plasmids

Christopher S Campbell et al. J Cell Biol. .

Abstract

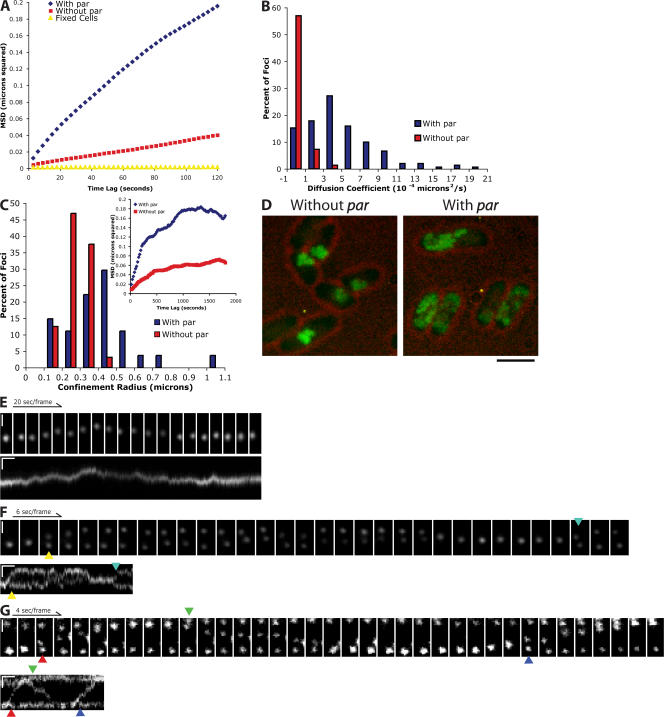
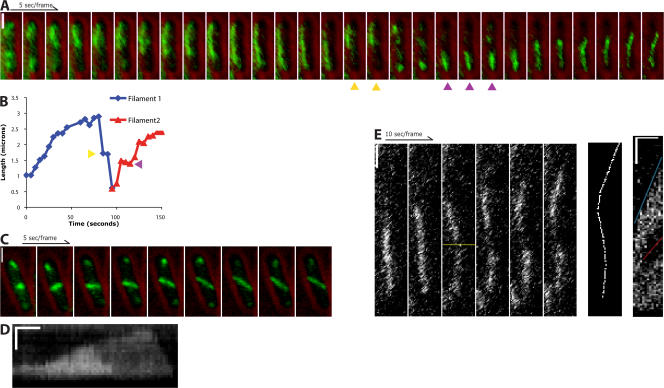
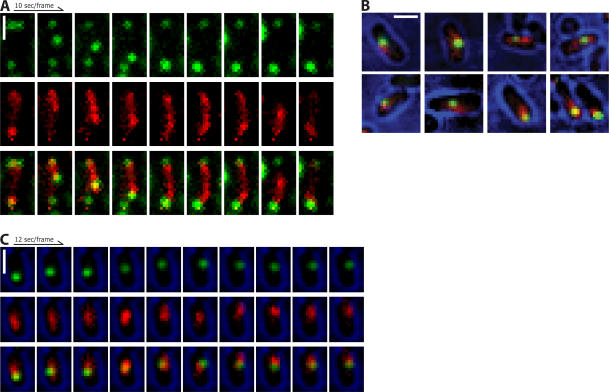
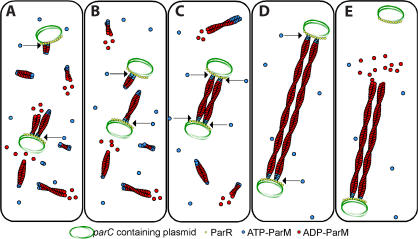
Type II par operons harness polymerization of the dynamically unstable actin-like protein ParM to segregate low-copy plasmids in rod-shaped bacteria. In this study, we use time-lapse fluorescence microscopy to follow plasmid dynamics and ParM assembly in Escherichia coli. Plasmids lacking a par operon undergo confined diffusion with a diffusion constant of 5 x 10(-5) microm(2)/s and a confinement radius of 0.28 microm. Single par-containing plasmids also move diffusively but with a larger diffusion constant (4 x 10(-4) microm(2)/s) and confinement radius (0.42 microm). ParM filaments are dynamically unstable in vivo and form spindles that link pairs of par-containing plasmids and drive them rapidly (3.1 microm/min) toward opposite poles of the cell. After reaching the poles, ParM filaments rapidly and completely depolymerize. After ParM disassembly, segregated plasmids resume diffusive motion, often encountering each other many times and undergoing multiple rounds of ParM-dependent segregation in a single cell cycle. We propose that in addition to driving segregation, the par operon enables plasmids to search space and find sister plasmids more effectively.


Figures

Figure 1.
Figure 1.
Par-containing plasmids undergo both rapid, directional and slow, diffusive movements. Arrows point to the initiation of segregation events. The colors of the arrows are coordinated between image montages and kymographs. (A) MSD versus time lag for plasmids with the par operon (pRBJ460; average of 151 foci) and those that do not contain the par operon (pRBJ461; average of 99 foci). (B) Distribution of diffusion coefficients for plasmids with and without the par operon. The diffusion coefficient was measured by taking the slope of individual MSD versus time lag traces and dividing by four (for the 2° of freedom). (C) Distribution of confinement radii for plasmids with (n = 27) and without (n = 32) the par operon. The plateau of each MSD was estimated by averaging the 1,600–1,800-s time points. The square root of the plateau value was then taken to obtain the confinement radius for each trace. (inset) Representative traces of MSD versus time lag for the longer time intervals used to estimate confinement sizes. (D) Maximum intensity projection of plasmids with and without the par operon over the course of a 2,000-s time series. Bar, 1.8 μm. (E) Cell with a single par-containing plasmid focus exhibiting diffusive movements. (F) Cell with two par-containing plasmid foci displaying mostly diffusive movements with occasional periods of rapid segregation. (G) Example of the rapid pole to pole movements seen in cells with three par-containing plasmid foci. Vertical bars, 1 μm; horizontal bars, 20 s. All images were contrast adjusted for clarity and rotated for ease of presentation.
Figure 2.
Figure 2.
ParM forms dynamic filaments in E. coli. Time-lapse fluorescence microscopy of live cells expressing GFP-ParM and a plasmid containing the R1 par operon. (A and C) GFP-ParM (green) is superimposed over single brightfield images (red) taken directly before or after the time series. (A) A ParM spindle polymerizes from one pole to the other, stalls, and depolymerizes. A second spindle forms at the opposite pole and polymerizes in the other direction. Because of photobleaching, each frame in the series was contrast adjusted individually. (B) Length of the spindles in A measured over time. Pauses can be seen during the depolymerization of the first spindle (yellow arrows) and polymerization of the second spindle (magenta arrows). (C) Reorientation of a spindle upon contact with the sides of the cell. (D) Kymograph of a spindle that depolymerizes in two stages. Horizontal bar, 20 s of elapsed time. (E) Spindles elongate equally from each end. A polymerizing spindle was photobleached to create a fiducial mark (third frame, yellow line). The seventh frame is the line that was drawn to create the kymograph to the right. The red line is the rate of displacement of the photobleached spot by polymerization of the bottom of the spindle against the end of the bacterium (21 nm/s). The blue line is the rate of elongation of the entire spindle (44 nm/s). Horizontal bar in the kymograph, 50 s of elapsed time. Vertical bars, 1 μm. All images were contrast adjusted for clarity and rotated for ease of presentation.
Figure 3.
Figure 3.
Near-simultaneous visualization of ParM and plasmids. ParM, red; plasmids, green. (A) Plasmids colocalize with the ends of spindles as they polymerize across the cell. (B) Colocalization of ParM and plasmids in cells with only one plasmid focus. (C) Time-lapse series of a cell with a single plasmid focus. Brightfield (blue) is a single image taken directly after the time series and superimposed over the fluorescence images. Bars, 1 μm. All images were contrast adjusted for clarity and rotated for ease of presentation.
Figure 4.
Figure 4.
Molecular model of plasmid segregation by the R1 par operon. (A) Nucleation of new filaments will happen throughout the cell. Filaments attached to one plasmid will search for a second plasmid. (B) Plasmids will diffuse around the cell until they get close enough to encounter each other. (C) When two plasmids come within close proximity, filaments will be bound at each end by a plasmid, forming a spindle. This will prevent the filaments from undergoing catastrophe. (D) As these stabilized filaments polymerize, the two plasmids will be forced to opposite poles. If the ends of a spindle run into the sides of the cell, it will be followed along the membrane to the ends of the cell. (E) After reaching a pole, pushing against both ends of the cell causes the filament to dissociate from the plasmid at one end and quickly depolymerize.

References

    1. Collins, J., and R.H. Pritchard. 1973. Relationship between chromosome replication and F'lac episome replication in Escherichia coli. J. Mol. Biol. 78:143–155. - PubMed
    1. Ebersbach, G., and K. Gerdes. 2005. Plasmid segregation mechanisms. Annu. Rev. Genet. 39:453–479. - PubMed
    1. Ebersbach, G., D.J. Sherratt, and K. Gerdes. 2005. Partition-associated incompatibility caused by random assortment of pure plasmid clusters. Mol. Microbiol. 56:1430–1440. - PubMed
    1. Elowitz, M.B., M.G. Surette, P.E. Wolf, J.B. Stock, and S. Leibler. 1999. Protein mobility in the cytoplasm of Escherichia coli. J. Bacteriol. 181:197–203. - PMC - PubMed
    1. Garner, E.C., C.S. Campbell, and R.D. Mullins. 2004. Dynamic instability in a DNA-segregating prokaryotic actin homolog. Science. 306:1021–1025. - PubMed

Publication types

MeSH terms

Substances