. 2008 Apr 15;111(8):4220-32.
doi: 10.1182/blood-2007-07-101691. Epub 2007 Nov 26.

NSOM/QD-based nanoscale immunofluorescence imaging of antigen-specific T-cell receptor responses during an in vivo clonal Vγ2Vδ2 T-cell expansion

Affiliations

NSOM/QD-based nanoscale immunofluorescence imaging of antigen-specific T-cell receptor responses during an in vivo clonal Vγ2Vδ2 T-cell expansion

Yong Chen et al. Blood. .

Abstract

Nanoscale imaging of an in vivo antigen-specific T-cell immune response has not been reported. Here, the combined near-field scanning optical microscopy- and fluorescent quantum dot-based nanotechnology was used to perform immunofluorescence imaging of antigen-specific T-cell receptor (TCR) response in an in vivo model of clonal T-cell expansion. The near-field scanning optical microscopy/quantum dot system provided a best-optical-resolution (<50 nm) nano-scale imaging of Vgamma2Vdelta2 TCR on the membrane of nonstimulated Vgamma2Vdelta2 T cells. Before Ag-induced clonal expansion, these nonstimulating Vgamma2Vdelta2 TCRs appeared to be distributed differently from their alphabeta TCR counterparts on the cell surface. Surprisingly, Vgamma2Vdelta2 TCR nanoclusters not only were formed but also sustained on the membrane during an in vivo clonal expansion of Vgamma2Vdelta2 T cells after phosphoantigen treatment or phosphoantigen plus mycobacterial infection. The TCR nanoclusters could array to form nanodomains or microdomains on the membrane of clonally expanded Vgamma2Vdelta2 T cells. Interestingly, expanded Vgamma2Vdelta2 T cells bearing TCR nanoclusters or nanodomains were able to rerecognize phosphoantigen and to exert better effector function. These studies provided nanoscale insight into the in vivo T-cell immune response.


Figures
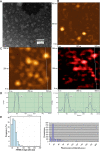
Figure 1
Figure 1
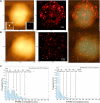
Combined aperture NSOM and fluorescent QD nanotechnology conferred approximately 50-nm resolution scale fluorescence imaging of individual QD655 on glass substrate. (A) Electron micrograph of fluorescent quantum dots (QD655). These disperse semiconductor nanocrystals have a diameter of approximately 10 nm under EM. The EM image was derived from a JEOL JEM-1220 transmission electron microscope using a standard EM protocol. (B) NSOM topographic image of the surface of clean glass substrates (no detectable fluorescence; data not shown). (C) NSOM topographic (left) and corresponding fluorescence (right) images of individual Ab-conjugated QD655 molecules. Scan size: 500 nm × 500 nm. Resolution: 300 pixel × 300 pixel. Integration time: 10 ms. (D) The height (left) and fluorescence intensity (right) profiles of the cross sections corresponding to the white lines on images of panel C. (C,D) The diameters of individual Ab-conjugated QD655 are predominantly approximately 50 nm both in topography and fluorescence intensity, which is consistent with that of individual quantum dots bound to TCR on cell membrane surface as shown in Figure 2. Similar results were seen for streptavidin-conjugated fluorescent QD (data not shown). (E) The left histogram shows the frequency or distribution for the immunofluorescence FWHM of individual Ab-conjugated QD655 molecules (n = 608); the right histogram shows fluorescence intensity distribution of Ab-conjugated QD655 on the same glass substrate. Mean diameters of the individual conjugated QD655 were 51.63 plus or minus 13.46 nm (mean ± SD), with approximately 50-nm dots being predominant (left histogram); the scale 20 was the dominant fluorescent intensity unit of the individual conjugated QD655 on the glass substrate (right histogram). The scale 20 was the weakest fluorescence intensity counts, even on the glass substrate prepared from further dilutions of QDs (≤ 10 intensity scales are background).
Figure 2
Figure 2
The NSOM/QD-based system conferred approximately 50-nm resolution scale fluorescence imaging of QD-bound γδ TCR on cell membrane of nonstimulated Vδ2 T cells. (A) Low-magnification NSOM topographic and (B) fluorescence images of 7 nonstimulated blood lymphocytes. Vδ2 TCR+ T cells are indicated with a smiley face. (C) The high-magnification NSOM fluorescence and topographic (inset) images of the cell marked by a smiley face as shown in panel A. (D) The fluorescence intensity profile of the cross section between the 2 fluorescent objects marked by 2 arrows in panel C. The short arrow shows an approximately 41-nm fluorescence dot representing a 1-QD–bound TCR dot, and the long arrow shows an approximately 80-nm fluorescence dot possibly corresponding to 2-QD-bound TCR cluster. (E) The NSOM fluorescence images enlarged from an area in panel C (inset: the corresponding topographic image). The higher-magnification imaging shows immunofluorescence images of individual 1× approximately 50-nm TCR dots (short arrows), 2× approximately 50-nm TCR cluster (long arrow), and more than 2× approximately 50-nm TCR clusters (dotted circles). (F) The fluorescent intensity profile of the cross section of the objects marked by a dashed line in panel E. Scan size: (C) 11 × 11 μm2; (E) approximately 1 × 1 μm2. Resolution: (C) 500 × 500 pixel2; (E) 400 × 400 pixel2. Integration time: (C) 15 ms; (E) 10 ms. (G) The left histogram showing the frequency or distribution for the immunofluorescence FWHM of individual Ab-QD–bound TCR (n = 326) on cell membrane of cells; the right histogram showing fluorescence intensity distribution of Ab-QD–bound TCR on the same cells. Mean FWHM diameters of the QD-Ab-bound TCR were 53.7 plus or minus 18.9 nm (mean ± SD), with approximately 50-nm dots being predominant (left histogram); the scale 20 was the dominant fluorescent intensity count of the individual QD-Ab-bound TCR on the cell membrane of cells (right histogram). Similar to what is seen in Figure 1E, individual QD-Ab–bound TCR dots exhibited a good relationship between approximately 50-nm dots and 20 intensity counts (basic-scale fluorescence) on the cell membrane (< 10 intensity scales were background). The excitation condition was the same as that described in Figure 1E. Scan size: 500 nm × 500 nm. Resolution: 300 pixel × 300 pixel. Integration time: 10 ms. The imaging was derived from Ab-conjugated QD655 as the second Ab. Similar results were seen when using QD655-streptavidin.
Figure 3
Figure 3
Before Ag-induced clonal expansion, nonengaging γδ TCR on nonstimulated T cells appeared to be distributed differently from their αβ TCR counterparts. Figures show topographic (left), fluorescence (middle), and merged topographic-fluorescence (right) NSOM images of αβ TCR on Vβ5+T cells (A) and γδ TCR on Vδ2+T cells (B), respectively. Note the Vβ5+T cell displaying the immunofluorescence TCR was derived from one of the 2 scanned Vβ5 cells as shown in the 2 lower-magnification graphs (25 × 25 μm2) inserted in the lower left (topographic) and lower right (fluorescence) bottom, respectively. See Figure 5B for NSOM images of a fluorescent Vγ2+ T cell and Figure S1 for more Vβ5+ and Vδ2+ T cells, and Vβ3.1+, and Vβ17+ αβ T cells. Scan size: (A) 8 × 8 μm2; (B) 7 × 7 μm2. Resolution: (A,B) 500 × 500 pixel2. Integration time: (A) 30 ms; (B) 10 ms. (C) The histograms showing a frequency difference in immunofluorescence TCR (size distribution) between the αβ T cell (left) and γδ T cell (right) using the Image-Plus software-based analysis. The data are the means calculated from up to 5 Vβ5+ cells (n = 1314) and 5 Vδ2+ cells (n = 5153). γδ T cells had more approximately 50-nm TCR dots distributed on cell surface than αβ T cells (P < .05).
Figure 4
Figure 4
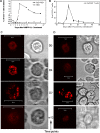
Confocal microscopy showed that Vγ2Vδ2 TCR underwent aggregating or capping during the in vivo clonal expansion of Vγ2Vδ2 T cells after the phosphoantigen treatment. (A,B) The increased mean numbers of Vγ2Vδ2 T cells in the blood of 3 monkeys after HMBPP/IL-2 treatment (A) and 2 monkeys after Picostim/IL2 treatment (B). Almost all expanded γδ T cells were Vγ2Vδ2 T cells coexpressing both Vγ2 and Vδ2. (C,D) Representative confocal microscopic data that show the formation of aggregating and capping TCR on the clonally expanded Vγ2Vδ2 T cells at days 4 and 7 after HMBPP/IL-2 (C) or Picostim/IL-2 (D) treatment. In both panels C and D, the left panel shows fluorescence images and the right panel shows differential interference contrast. All clonally expanded Vγ2Vδ2 T cells examined on days 4 and 7 after the treatment exhibited indistinguishable large TCR aggregates or capped dots, sustained for 1 to 2 weeks, and then finally returned to the normal nonaggregated status at week 3 after the treatment (detailed data, see Figures S2,S3).
Figure 5
Figure 5
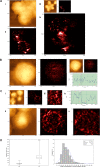
NSOM/QD-based imaging showed that Vγ2Vδ2 TCR arrayed to form high-density TCR nanoclusters, nanodomains, and microdomains during the in vivo clonal expansion of Vγ2Vδ2 T cells after HMBPP/IL-2 treatment. (A) Representative NSOM images of TCR nanoclusters, nanodomains, and microdomains on the membrane of clonally expanded Vδ2 T cells on day 4. (Ai) NSOM topographic images of 3 closely adjacent cells as marked by a smiley face in the low-magnification images showing 6 closely adjacent cells in panel Aiii. (Aii) The NSOM fluorescence image displaying the polarized γδ TCR nanoclusters, nanodomains, and microdomains on the 2 corresponding Vδ2 T cells as shown in panel Ai. (Aiv) The enlarged NSOM fluorescence image of TCR nanoclusters, nanodomains, and microdomains on the Vδ2 T cell shown in the upper left of panel Aii. (B) Representative NSOM topographic (left) and fluorescence (middle) images indicating the dominance of nonengaging fluorescence TCR dots on the membrane of unstimulated Vγ2 T cells on day 0. The fluorescent intensity profile graph (right) is extracted from a random cross section in the fluorescence image (middle) showing that predominant fluorescence TCR dots here displayed FWHM of approximately 50 nm. (C) Representative NSOM images of TCR nanoclusters, nanodomains, and microdomains on the membrane of clonally expanded Vγ2 T cells on day 4. (Cii) Enlarged from the boxed area in the low-magnification NSOM image panel Ci. The fluorescence intensity profile (Civ) is extracted from the cross-sectional part (dashed arrow in Ciii), which is enlarged from the boxed area in panel Cii. (Cv) The NSOM fluorescence image of another activated/expanded Vγ2 T cell collected on day 4. (D) Boxplot (left) and histogram (right) showing the FWHM of approximately 50-nm TCR dots and TCR nanoclusters/nanodamains/microdomains before and day 4 after HMBPP/IL-2 treatment. (**P < .001 vs the values of the unstimulated cells). In the left panel, the center line is the median, the dot is the mean, the boxes are interquartile ranges, and the whiskers are the value ranges. The histogram on the right shows the percentages of different sizes of TCR clusters in total γδ TCR that were counted and measured. The data are the mean frequencies calculated from 5 Vδ2+ and Vγ2+ T cells. Scan size: (Aiii, Ci) 25 × 25 μm2; (Ai,ii, Cii) 15 × 15 μm2; (Cv) 11.5 × 11.5 μm2; (Aiv, B) 9 × 9 μm2; (Ciii) 4.5 × 4.5 μm2. Resolution: (Aiii, Ci) 300 × 300 pixel2; (Ai, Aii, B) 400 × 400 pixel2; (Aiv, Cii,iii, and Cv) 500 × 500 pixel2. Integration time (ms): (Aii-iv) 40; (B) 15; (Ci-iii) 10; (Cv) 20.
Figure 6
Figure 6
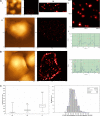
High-density TCR nanoclusters, nanodomains, and microdomains were also developed during the in vivo clonal expansion of Vγ2Vδ2 T cells after the Picostim/IL-2 treatment. (A) Representative NSOM images of TCR nanoclusters, nanodomains, and microdomains on the membrane of clonally expanded Vδ2 T cells on day 4. On the left are topographic images; on the right are fluorescent images. The images in panel Ai-Aiv are sequential magnification images from the boxed area in the image. The mean clusters on the cells at this time point are 132.7 plus or minus 37.1 nm, a nanoscale imaging that cannot be reached by confocal microscopy because of the limited optical resolution (∼300 nm). Scanning sizes: (Ai) 25 × 25 μm2; 300 × 300 pixel2; (Aii) 15 × 15 μm2; 500 × 500 pixel2; (Aiv) 1.5 × 1.5 μm2; 300 × 300 pixel2. (Av) Fluorescent intensity profile of the cross section of the objects (the (dashed line in panel Aiv). Shown are 2 TCR clusters with diameters (FWHM) of 56 nm and 114 nm, respectively. Integration time in panels Ai to Aiv: 30 ms. (B) Representative NSOM images of TCR nanoclusters, nanodomains, and microdomains on the membrane of clonally expanded Vδ2 T cells on day 7 after Picostim/IL-2 treatment. Shown are the NSOM topographic (left) and fluorescence (middle) images (16 × 16 μm2; 500 × 500 pixel2; integration time: 30 ms) of a Vγ2Vδ2 T cell. The TCR clusters on the cells at this time point are 315.6 plus or minus 102.4 nm. The fluorescent intensity profile (right) of the cross section of the objects is marked by a line in the fluorescence image (middle). Shown are 2 TCR clusters with diameters of 234 nm and 700 nm (FWHM), respectively. (C) Boxplot (left) and histogram (right) graphs showing the FWHM of approximately 50-nm TCR dots and TCR nanoclusters/nanodamains/microdomains before and days 4 and 7 after Picostim/IL-2 treatment. Box and whisker plot is as described in Figure 5D. (**P < .001 vs the values of the unstimulated cells.) The histogram on the right shows the percentages of different sizes of TCR clusters in total γδ TCR that were counted and measured. The data are the mean frequencies calculated from 5 Vδ2+ and Vγ2+ cells.
Figure 7
Figure 7
Vγ2Vδ2 T cells bearing high-density TCR nanoclusters were still capable to rerecognize phosphoantigen and to exert effector function during the phosphoantigen-mediated clonal expansion. (A) Flow cytometry histogram indicating that expanded Vγ2Vδ2 T cells bearing high-density TCR nanoclusters were able to rerecognize phosphoantigen and exert better effector function of IFNγ or perferin production compared with the nonstimulating Vγ2Vδ2 T cells that had few or no nanoclusters. Shown are the representative data from one of 3 monkeys on day 4 after HMBPP/IL-2 treatment. The cells shown in the histograms were CD3-gated (P < .05 for the difference in perforin or IFNγ levels between day 4 and pretested cells). Negative controls using medium alone or an irrelevant peptide did not induce detectable numbers of Vγ2Vδ2 T effector cells. (B) The percentage of Vγ2 T cells that expressed either IFNγ or perforin in response to phosphoantigen HMBPP. Data were derived from PBLs collected from 2 monkeys on day 7 after phosphoantigen Picostim/IL-2 treatment. Error bars represent SEM.

References

    1. Varma R, Campi G, Yokosuka T, Saito T, Dustin ML. T cell receptor-proximal signals are sustained in peripheral microclusters and terminated in the central supramolecular activation cluster. Immunity. 2006;25:117–127. - PMC - PubMed
    1. Yokosuka T, Sakata-Sogawa K, Kobayashi W, et al. Newly generated T cell receptor microclusters initiate and sustain T cell activation by recruitment of Zap70 and SLP-76. Nat Immunol. 2005;6:1253–1262. - PubMed
    1. Billadeau DD, Burkhardt JK. Regulation of cytoskeletal dynamics at the immune synapse: new stars join the actin troupe. Traffic. 2006;7:1451–1460. - PMC - PubMed
    1. Campi G, Varma R, Dustin ML. Actin and agonist MHC-peptide complex-dependent T cell receptor microclusters as scaffolds for signaling. J Exp Med. 2005;202:1031–1036. - PMC - PubMed
    1. Anikeeva N, Lebedeva T, Clapp AR, et al. Quantum dot/peptide-MHC biosensors reveal strong CD8-dependent cooperation between self and viral antigens that augment the T-cell response. Proc Natl Acad Sci U S A. 2006;103:16846–16851. - PMC - PubMed

Publication types

MeSH terms

Substances