

doi: 10.1073/pnas.0707962104.
Epub 2007 Nov 26.
Does the H index have predictive power?
Affiliations
- PMID: 18040045
- PMCID: PMC2148266
- DOI: 10.1073/pnas.0707962104
Item in Clipboard
Does the H index have predictive power?
Proc Natl Acad Sci U S A.
.
Abstract
Bibliometric measures of individual scientific achievement are of particular interest if they can be used to predict future achievement. Here we report results of an empirical study of the predictive power of the h index compared with other indicators. Our findings indicate that the h index is better than other indicators considered (total citation count, citations per paper, and total paper count) in predicting future scientific achievement. We discuss reasons for the superiority of the h index.
Conflict of interest statement
The author declares no conflict of interest.
Figures
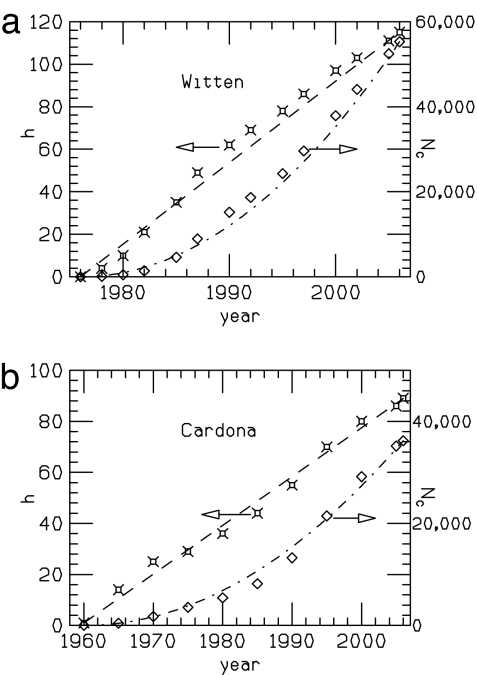
h index vs. time (left scale) and total number of citations (Nc) vs. time (right scale) for E. Witten (theorist) (a) and M. Cardona (experimentalist) (b). The dashed and dash-dotted lines show linear and quadratic fits to the h index and Nc, respectively.
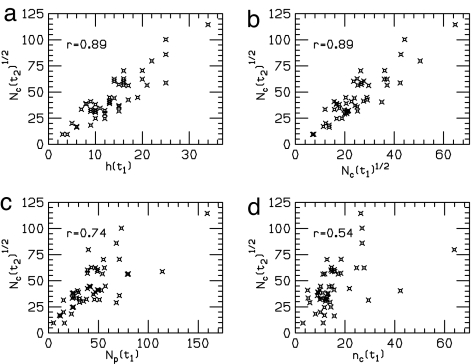
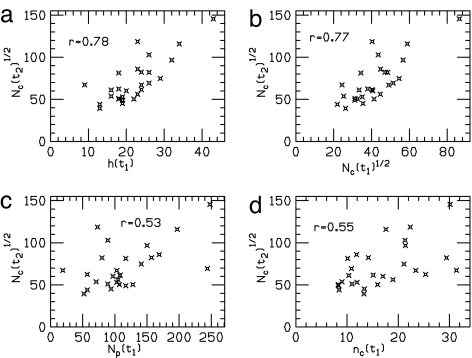
Scatter plots of total number of citations, Nc, after t2 = 24 yr vs. the value of the various indicators at t1 = 12 yr (t measured from the date of the first publication). h, h index; Np, number of papers; nc, mean number of citations per paper; r, correlation coefficient, with r = 1 corresponding to perfect linear correlation.
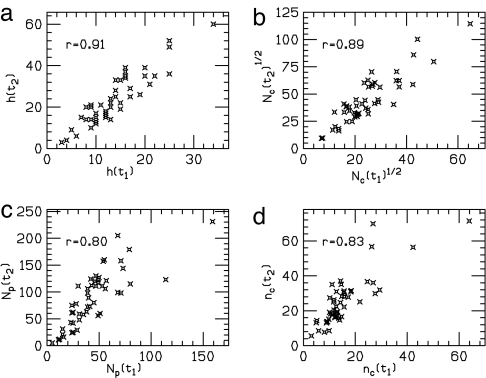
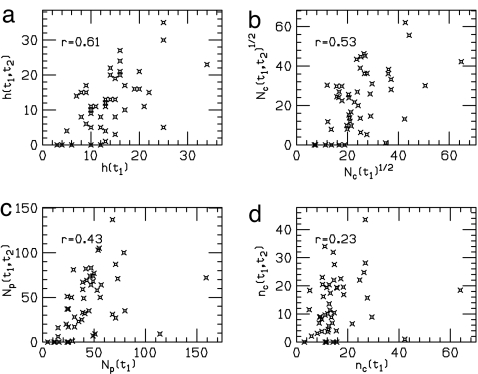
Predictive power of each indicator at time t1 = 12 yr for the value of the same indicator at time t2 = 24 yr for sample PRB80.
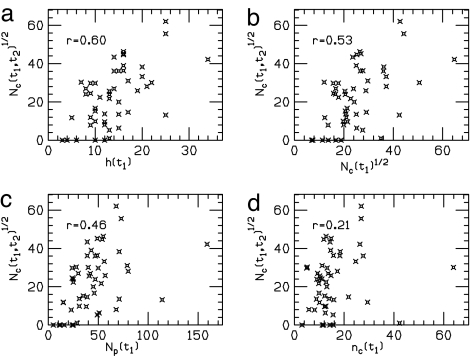
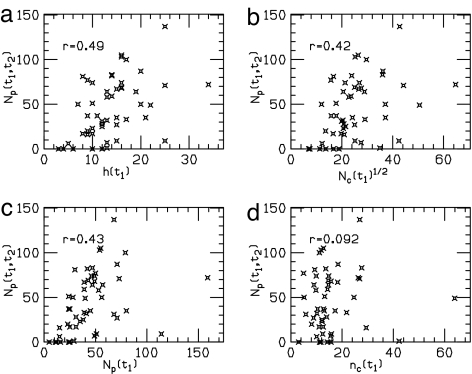
Predictive power of each indicator at time t1 = 12 yr for the number of citations to papers published in the t1 − t2 time interval, with t2 = 24 yr, for sample PRB80.
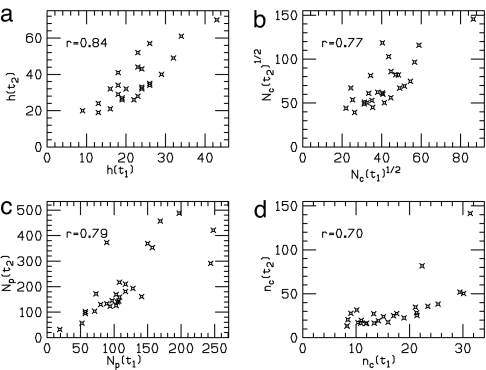
Predictive power of each indicator at time t1 = 12 yr for the value of the same indicator for the papers published in the t1 − t2 time interval, with t2 = 24 yr, for sample PRB80.
Predictive power of each indicator at time t1 = 12 yr for the number papers published in the t1 − t2 time interval, with t2 = 24 yr, for sample PRB80.
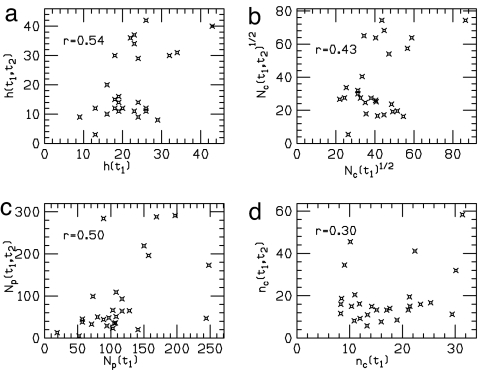
Predictive power of each indicator at year 1994 for the number of citations to papers published in the 1995–2006 time interval, for sample APS95.
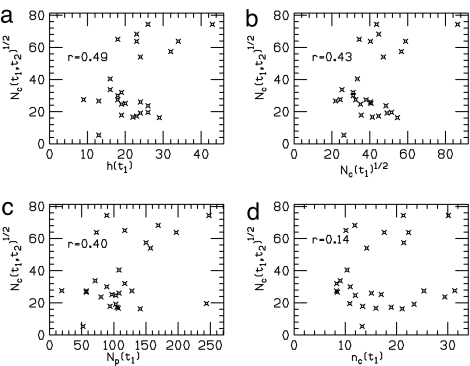
Predictive power of each indicator at year 1994 for the value of the same indicator for the papers published in the 1995–2006 time interval, for sample APS95.
Predictive power of each indicator at year 1994 for the number of citations to all papers published up to 2006, for sample APS95.
Predictive power of each indicator at year 1994 for the value of the same indicator at year 2006, for sample APS95.
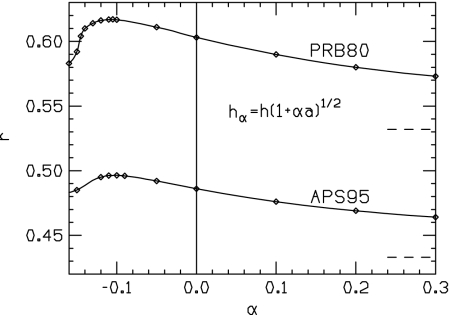
Correlation coefficient, r, between Nc(t1, t2) and hα defined in Eq. 2, for samples PRB80 and APS95. As α increases, the curves approach the asymptotic values given by the dashed lines, r = 0.53 and r = 0.43, respectively.
References
-
- Lehmann S, Jackson AD, Lautrup BE. 2007. http://arxiv.org/abs/physics/0701311.
-
- Lehmann S, Jackson AD, Lautrup BE. Nature. 2006;444:1003–1004. - PubMed
-
- Egghe L. Scientometrics. 2006;69:131–152.
-
- Jin B-H, Liang L-M, Rousseau R, Egghe L. Chin Sci Bull. 2007;52:855–863.
MeSH terms
LinkOut - more resources
Full Text Sources
