Model-free group analysis shows altered BOLD FMRI networks in dementia
- PMID: 18041738
- PMCID: PMC6870626
- DOI: 10.1002/hbm.20505
Model-free group analysis shows altered BOLD FMRI networks in dementia
Abstract
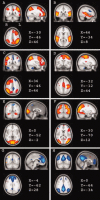
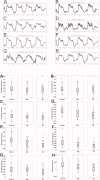
FMRI research in Alzheimer's disease (AD) and mild cognitive impairment (MCI) typically is aimed at determining regional changes in brain function, most commonly by creating a model of the expected BOLD-response and estimating its magnitude using a general linear model (GLM) analysis. This crucially depends on the suitability of the temporal assumptions of the model and on assumptions about normality of group distributions. Exploratory data analysis techniques such as independent component analysis (ICA) do not depend on these assumptions and are able to detect unknown, yet structured spatiotemporal processes in neuroimaging data. Tensorial probabilistic ICA (T-PICA) is a model free technique that can be used for analyzing multiple subjects and groups, extracting signals of interest (components) in the spatial, temporal, and also subject domain of FMRI data. We applied T-PICA and model-based GLM to study FMRI signal during face encoding in 18 AD, 28 MCI patients, and 41 healthy elderly controls. T-PICA showed activation in regions associated with motor, visual, and cognitive processing, and deactivation in the default mode network. Six networks showed a significantly decreased response in patients. For two networks the T-PICA technique was significantly more sensitive to detect group differences than the standard model-based technique. We conclude that T-PICA is a promising tool to identify and detect differences in (de)activated brain networks in elderly controls and dementia patients. The technique is more sensitive than the commonly applied model-based method. Consistent with other research, we show that networks of activation and deactivation show decreased reactivity in dementia.
(c) 2007 Wiley-Liss, Inc.
Figures


References
-
- Beckmann CF,Smith SM ( 2004): Probabilistic independent component analysis for functional magnetic resonance imaging. IEEE Trans Med Imag 23(2): 137–152. - PubMed
-
- Beckmann CF,Smith SM ( 2005): Tensorial extensions of independent component analysis for multisubject FMRI analysis. Neuroimage 25(1): 294–311. - PubMed
-
- Beckmann CF,Woolrich MW,Smith SM. ( 2003): Gaussian/Gamma mixture modelling of ICA/GLM spatial maps. Ninth Int Conf Funct Mapp Human Brain 19(2): S985.
-
- Binder JR,Frost JA,Hammeke TA,Bellgowan PS,Rao SM,Cox RW ( 1999): Conceptual processing during the conscious resting state. A functional MRI study. J Cogn Neurosci 11(1): 80–95. - PubMed
Publication types
MeSH terms
LinkOut - more resources
Full Text Sources
Medical
Miscellaneous

