. 2008 Jan;91(1):30-40.
doi: 10.1016/j.ygeno.2007.10.002. Epub 2007 Nov 26.

Transgenerational epigenetic programming of the embryonic testis transcriptome

Affiliations

Transgenerational epigenetic programming of the embryonic testis transcriptome

Matthew D Anway et al. Genomics. 2008 Jan.

Abstract

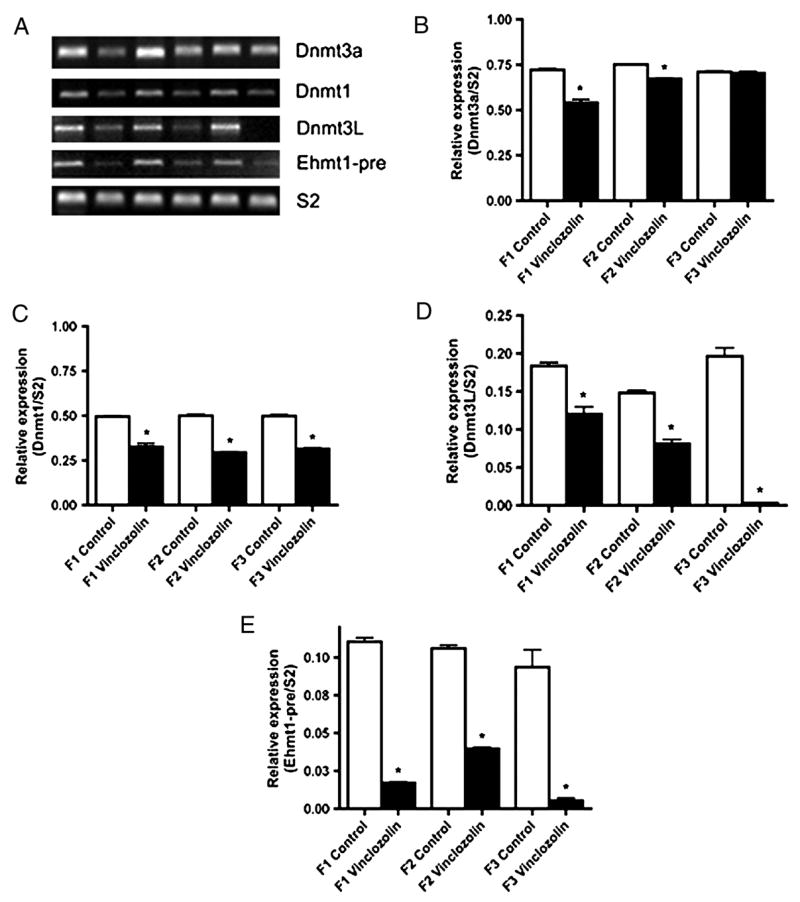
Embryonic exposure to the endocrine disruptor vinclozolin during gonadal sex determination appears to promote an epigenetic reprogramming of the male germ line that is associated with transgenerational adult-onset disease states. Transgenerational effects on the embryonic day 16 (E16) testis demonstrated reproducible changes in the testis transcriptome for multiple generations (F1-F3). The expression of 196 genes was found to be influenced, with the majority of gene expression being decreased or silenced. Dramatic changes in the gene expression of methyltransferases during gonadal sex determination were observed in the F1 and F2 vinclozolin generation (E16) embryonic testis, but the majority returned to control-generation levels by the F3 generation. The most dramatic effects were on the germ-line-associated Dnmt3A and Dnmt3L isoforms. Observations demonstrate that an embryonic exposure to vinclozolin appears to promote an epigenetic reprogramming of the male germ line that correlates with transgenerational alterations in the testis transcriptome in subsequent generations.


Conflict of interest statement

Disclosure: None of the authors have a financial or conflict of interest to disclose

Figures

Figure 1
Figure 1
Embryonic day 16 (E16) testis histology and cellular apoptosis. E16 testis from F2 control (A, C) and vinclozolin (B, D) generation animals for histology (A, B) and TUNEL apoptosis staining (C, D). The number of apoptotic germ cells/section (E) for F1-F3 control and vinclozolin generation E16 testes are presented, mean ± SEM, from three different experiments, and compared to control wildtype rat E16 testis (Wildtype). An asterisk (*) indicates a statistical difference from control (p<0.05).
Figure 2
Figure 2
The E16 testis transcriptome microarray analysis from F1-F3 control and vinclozolin generation animals. (A) Dendogram for total regulated genes with signal above 75. (B) Dendogram of 196 regulated gene list. (C) The 196 gene list relative expression levels between F1-F3 controls and vinclozolin (vincl) E16 testis. The scale in the right margin indicates no change (black), increase (red) and decrease (green).
Figure 3
Figure 3
Categorization of the F1-F3 regulated genes. (A) Venn diagram with total regulated (>1.5 fold-change between control and vinclozolin) genes listed and the overlap, with 196 shown to be consistent between the F1-F3 generations. (B) Categorization into functionally related gene groups with the number of genes (blue down-regulated and yellow up-regulated).
Figure 4
Figure 4
Methyltransferase gene expression in the F1-F3 control and vinclozolin generation E16 testis. Relative expression is presented for the specific genes after microarray analysis. The F1 and F2 vinclozolin generation gene expression for Dnmt3A, Dmap1, Dnmt2, Ehmt1 and Rnmt values were statistically different from the respective control generation values (p<0.05), with Dnmt1 statistically different in the F2 vinclozolin generation samples and Trmt1 not statistically different in any generation.
Figure 5
Figure 5
Semi-quantitative PCR analysis of (A & B) Dnmt3A, (A & C) Dnmt1, (A & D) Dnmt3L, (A & E) Ehmt1, and (A) the constitutively expressed S2. A representative electrophoretic gel of the PCR products is presented (A) and the combined data from 3 different experiments with normalization to S2 presented (B–E). The mean ± SEM is presented with asterisks (*) indicating a statistical difference (p<0.05) between control and vinclozolin generation F1-F3 E16 expression levels.

References

    1. Gluckman PD, Hanson MA. Developmental origins of disease paradigm: a mechanistic and evolutionary perspective. Pediatr Res. 2004;56:311–7. - PubMed
    1. Li E. Chromatin modification and epigenetic reprogramming in mammalian development. Nat Rev Genet. 2002;3:662–73. - PubMed
    1. Jiang YH, Bressler J, Beaudet AL. Epigenetics and human disease. Annu Rev Genomics Hum Genet. 2004;5:479–510. - PubMed
    1. Egger G, Liang G, Aparicio A, Jones PA. Epigenetics in human disease and prospects for epigenetic therapy. Nature. 2004;429:457–63. - PubMed
    1. Jirtle RL, Skinner MK. Environmental epigenomics and disease susceptibility. Nat Rev Genet. 2007;8:253–62. - PMC - PubMed

Publication types

MeSH terms