Comparative Study
. 2008 Feb;190(2):248-54.
doi: 10.1016/j.jmr.2007.11.004. Epub 2007 Nov 7.

Evaluation of sub-microsecond recovery resonators for in vivo electron paramagnetic resonance imaging

Affiliations
Comparative Study

Evaluation of sub-microsecond recovery resonators for in vivo electron paramagnetic resonance imaging

F Hyodo et al. J Magn Reson. 2008 Feb.

Abstract

Time-domain (TD) electron paramagnetic resonance (EPR) imaging at 300MHz for in vivo applications requires resonators with recovery times less than 1 micros after pulsed excitation to reliably capture the rapidly decaying free induction decay (FID). In this study, we tested the suitability of the Litz foil coil resonator (LCR), commonly used in MRI, for in vivo EPR/EPRI applications in the TD mode and compared with parallel coil resonator (PCR). In TD mode, the sensitivity of LCR was lower than that of the PCR. However, in continuous wave (CW) mode, the LCR showed better sensitivity. The RF homogeneity was similar in both the resonators. The axis of the RF magnetic field is transverse to the cylindrical axis of the LCR, making the resonator and the magnet co-axial. Therefore, the loading of animals, and placing of the anesthesia nose cone and temperature monitors was more convenient in the LCR compared to the PCR whose axis is perpendicular to the magnet axis.


Figures
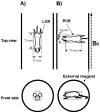
Figure 1
Figure 1
Schematic configuration of resonators in EPR instrument, A) LCR and B) PCR in the magnet.
Figure 2
Figure 2
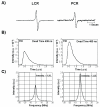
The 1D EPR spectra and FIDs of Oxo63. A) The EPR spectrum of Oxo63 in of LCR and PCR was obtained using 300 MHz CW EPR spectroscopy. The aqueous solution of Oxo63 had the total spin counts of 1.5 × 10¹⁸. B) Typical FIDs of oxo63 in LCR and PCR obtained by TD EPR. The instrumental parameters were follows: CW EPR sweep width = 5 G; scan time = 2 s, time constant = 0.003 s, modulation amplitude = 0.08 G and RF power = 2.5 mW. TD EPR pulse length = 120 ns, average = 20000 and repetition time = 20 μs. C) The absorption spectra obtained by Fourier transformation of the FIDs.
Figure 3
Figure 3
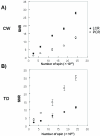
Comparison of SNR of Oxo63 solution using (A) CW and (B) TD EPR. The instrumental parameters of CW measurement were: Sweep width = 1 G, scan time = 2 s, time constant = 0.003 s, modulation amplitude = 0.08 G; and RF power 2.5 mW. TD EPR measurement; Q = 25, pulse width 100 ns for PCR and 140 ns for LCR, Sampling rate = 500 MS/s, number of averages = 1000, number of experiments = 5.
Figure 4
Figure 4
The B1 homogeneity maps in A) LCR and B) PCR obtained using signal intensity from point sample of NMP TCNQ measured using 300 MHz CW EPR. This is shown as a 2D image, with the B1 homogeneity in terms of the CW EPR image intensity distribution (arbitrary units) shown on the color bar.
Figure 5
Figure 5
Comparison of the image homogeneity from PCR and LCR using a flat slab-like spins phantom containing 2 mM Oxo63 solution. A) Schematic of the flat plate phantom. B) 2D CW EPR images of the flat plate phantom in LCR (left) and PCR (right). CW EPR imaging conditions were as follows: microwave frequency = 300 MHz, microwave power = 2.5 mW, modulation frequency = 13.5 kHz, modulation amplitude = 0.15 G, time constant = 0.003 s, FOV = 5 cm × 5 cm sweep width = 5 G, scan time = 2 s, number of projection = 18, field gradient = 1 G/cm and number of averages = 1. EPR image was reconstructed on 128 × 128 matrix by filtered back-projection method using Shepp-Logan filter.
Figure 6
Figure 6
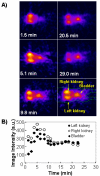
2D CW EPR images of a mouse in LCR with temperature control after injection of Oxo63 solution (A). The region of interest (ROI) was selected using EPR image (right-bottom). The time course of Oxo63 in kidney was computed by selecting the corresponding regions in the sequential images and averaging the pixel intensities. In vivo CW EPR, imaging conditions were the same as the phantom study except for time constant = 0.003 s, FOV was 7 × 7 cm, scan time = 162 s, sweep width = 15 G, number of projection = 18 and the magnitude of the field gradient = 2.5 G/cm. EPR image was reconstructed on 128 × 128 matrix by filtered back-projection with Shepp-Logan filter.

References

    1. Yasukawa K, Kasazaki K, Hyodo F, Utsumi H. Non-invasive analysis of reactive oxygen species generated in rats with water immersion restraint-induced gastric lesions using in vivo electron spin resonance spectroscopy. Free Radic Res. 2004;38:147–55. - PubMed
    1. Mikuni T, He G, Petryakov S, Fallouh MM, Deng Y, Ishihara R, Kuppusamy P, Tatsuta M, Zweier JL. In vivo detection of gastric cancer in rats by electron paramagnetic resonance imaging. Cancer Res. 2004;64:6495–502. - PubMed
    1. Yamato M, Egashira T, Utsumi H. Application of in vivo ESR spectroscopy to measurement of cerebrovascular ROS generation in stroke. Free Radic Biol Med. 2003;35:1619–31. - PubMed
    1. Matsumoto K, Subramanian S, Devasahayam N, Aravalluvan T, Murugesan R, Cook JA, Mitchell JB, Krishna MC. Electron paramagnetic resonance imaging of tumor hypoxia: enhanced spatial and temporal resolution for in vivo pO2 determination. Magn Reson Med. 2006;55:1157–63. - PubMed
    1. Mailer C, Sundramoorthy SV, Pelizzari CA, Halpern HJ. Spin echo spectroscopic electron paramagnetic resonance imaging. Magn Reson Med. 2006;55:904–12. - PubMed

Publication types

LinkOut - more resources