. 2008 Jan;18(1):46-59.
doi: 10.1101/gr.6654808. Epub 2007 Nov 27.

Genome-wide mapping and analysis of active promoters in mouse embryonic stem cells and adult organs

Affiliations

Genome-wide mapping and analysis of active promoters in mouse embryonic stem cells and adult organs

Leah O Barrera et al. Genome Res. 2008 Jan.

Abstract

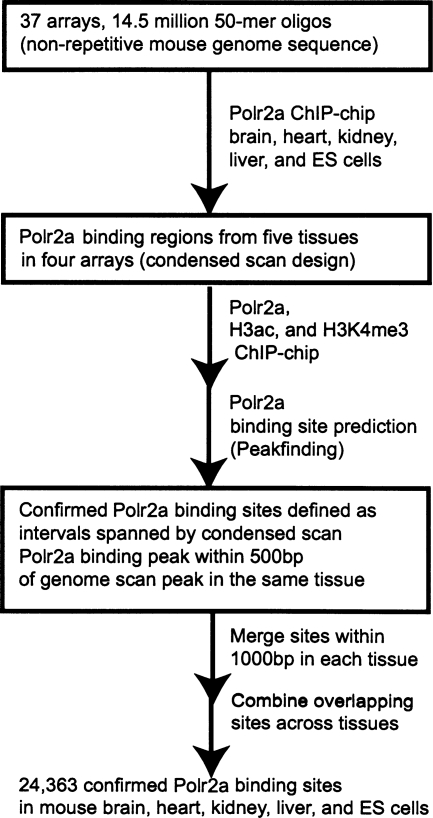
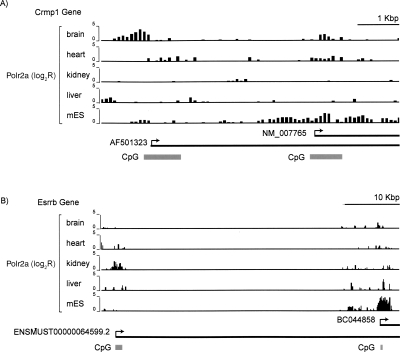
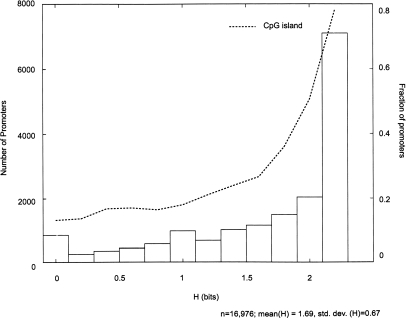
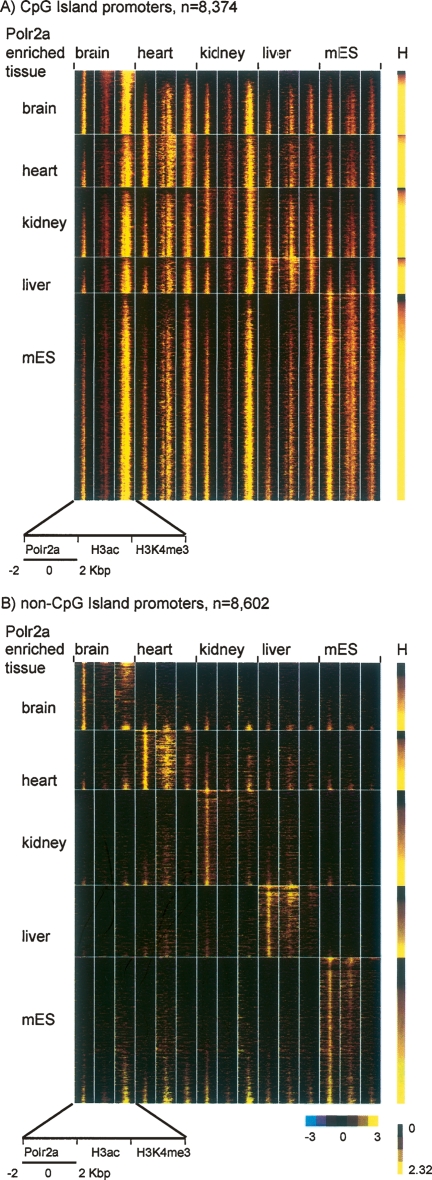
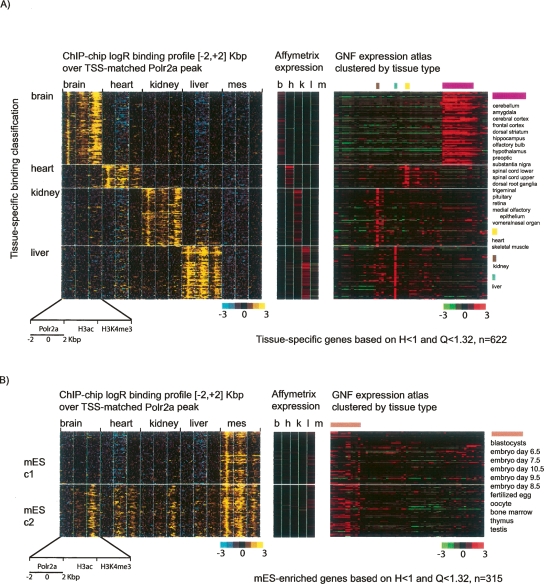
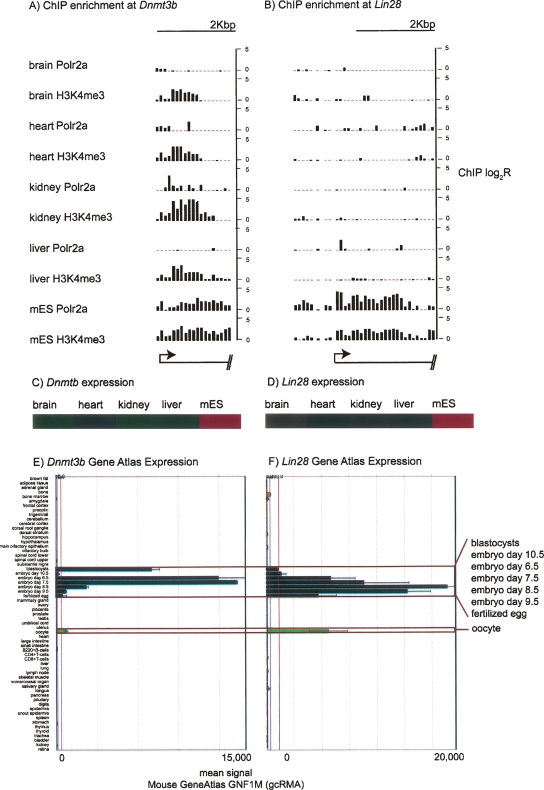
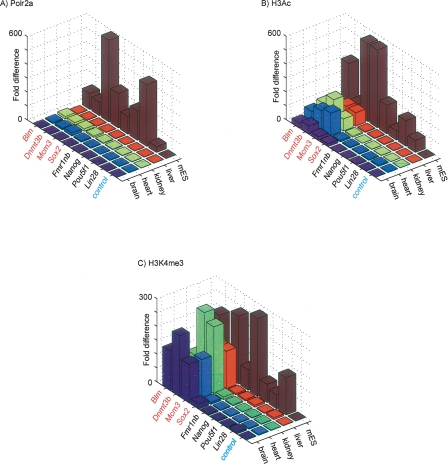
By integrating genome-wide maps of RNA polymerase II (Polr2a) binding with gene expression data and H3ac and H3K4me3 profiles, we characterized promoters with enriched activity in mouse embryonic stem cells (mES) as well as adult brain, heart, kidney, and liver. We identified approximately 24,000 promoters across these samples, including 16,976 annotated mRNA 5' ends and 5153 additional sites validating cap-analysis of gene expression (CAGE) 5' end data. We showed that promoters with CpG islands are typically non-tissue specific, with the majority associated with Polr2a and the active chromatin modifications in nearly all the tissues examined. By contrast, the promoters without CpG islands are generally associated with Polr2a and the active chromatin marks in a tissue-dependent way. We defined 4396 tissue-specific promoters by adapting a quantitative index of tissue-specificity based on Polr2a occupancy. While there is a general correspondence between Polr2a occupancy and active chromatin modifications at the tissue-specific promoters, a subset of them appear to be persistently marked by active chromatin modifications in the absence of detectable Polr2a binding, highlighting the complexity of the functional relationship between chromatin modification and gene expression. Our results provide a resource for exploring promoter Polr2a binding and epigenetic states across pluripotent and differentiated cell types in mammals.


Figures

Figure 1.
Figure 1.
Schematic of genome-wide promoter mapping strategy by ChIP-chip.
Figure 2.
Figure 2.
Polr2a binding profiles reveal alternative promoters usage across tissues. (A) ChIP-chip profiles for Polr2a spanning two alternative promoters for the Crmp1 gene. Each bar represents Polr2a ChIP-chip log2 ratio corresponding to a 50-bp probe. These probes are distributed along the genomic regions at 100-bp end-to-end spacing. (B) Similar Polr2a binding profile for the two alternative promoters of the Esrrb gene.
Figure 3.
Figure 3.
Quantitative index of tissue-specific Polr2a occupancy reveals an inverse relationship between CpG islands and tissue-specific promoter activity. Distribution of known promoters is plotted across a range of tissue-specificity, as measured by Shannon entropy (H) defined based on Polr2a ChIP-chip profiles (see Methods). On the primary Y-axis (left), promoter counts across the different bins (bin size = 0.2 bits) for the range of tissue-specificity values (H), H ∈ [0, log2(N)] are shown. Low values of H indicate tissue-specific expression and the maximal value denotes uniform expression across tissues surveyed. The second axis (right) shows the fraction of promoters within each bin overlapping CpG Islands (dashed line).
Figure 4.
Figure 4.
Polr2a binding and chromatin modification states at CpG and non-CpG island promoters across different mouse tissues. (A) ChIP-chip profiles of Polr2a, H3Ac, and H3K4me3 are shown in pseudocolors for CpG island promoters (n = 8374). Each row is the concatenation of the log2-transformed enrichment ratio over a 4-kbp window for Polr2a, H3ac, and H3K4me3 in brain, heart, kidney, liver, and mES. The yellow color indicates high enrichment ratios, while the black indicates no enrichment. The window is centered on the peak of Polr2a binding for the known CpG island promoter identified in these tissues. Rows are grouped according to the tissue with the highest relative Polr2a binding and ordered within each tissue according to the Polr2a entropy score or H (right bar). (B) ChIP-chip profiles of Polr2a, H3Ac, and H3K4me3 are shown for non-CpG island promoters (n = 8602). Note that subtle enrichments of H3ac and H3K4me3 revealed by these promoter profiles across tissues are not likely to be called “present” by typical ChIP-chip analysis methods.
Figure 5.
Figure 5.
Complex relationship between Polr2a occupancy and active chromatin modifications at the tissue-specific promoters. (A) Polr2a occupancy and chromatin modification profiles at brain, heart, kidney, or liver specific promoters are shown in black–yellow pseudocolors. Each row in the left panel is the concatenation of the ChIP-chip log2 ratio profile over a 4-kbp window for Polr2a, H3ac, and H3K4me3 in the corresponding tissue. The window is centered on the peak of Polr2a binding for the tissue-specific promoter. Along the same row for each promoter, the expression levels of the corresponding transcript across the same tissues is shown in red–green pseudocolors in the adjacent panel (middle panel). In addition, the corresponding transcript levels in the 61 tissues profiled in the GNF SymAtlas are also shown (right panel). Rows are grouped according to the tissue-specific classification (brain, heart, kidney, or liver) of the promoter based on Polr2a binding. (B) Polr2a binding, chromatin modifications, and expression profiles are shown for mES-specific promoters. Note that two classes of mES-specific promoters can be seen with distinct chromatin modification profiles in adult tissues. While both classes are characterized by ES-specific gene-expression profiles (middle and right panel), the chromatin modification states of these promoters are different in adult tissues.
Figure 6.
Figure 6.
Two examples of mES c1 and mES c2 promoters. (A) Polr2a and H3K4me3 ChIP-chip enrichment across tissues over the Lin28 promoter is shown in a bar graph. The 5′ end position (arrow) and relative gene orientation indicated by transcript schematic at the bottom. Each vertical bar represents the ChIP-chip log2 ratio for the corresponding 50-bp probe. (B) Similar promoter profile for Dnmt3b. (C) Relative expression of Lin28 across the tissues surveyed based on normalized log10 signals from Affymetrix expression profiling. Expression enrichment from low to high is represented by color gradient from green to black to red. (D) Relative expression for Dnmt3b. (E) Lin28 expression across a panel of cell types in the GNF expression atlas (copyright GNF). Each horizontal bar is the normalized signal for the tissue listed along the Y-axis. (F) Dnmt3b expression across a panel of cell types in the GNF expression atlas (copyright GNF).
Figure 7.
Figure 7.
Validation of mES c1 and c2 promoter classification using ChIP with quantitative PCR. (A) ChIP-qPCR fold difference for Polr2a ChIP DNA relative to input DNA is shown in (Z-axis) for the mES c2 promoters (Y-axis, red), mES c1 promoters (Y-axis, black), and an intergenic control (Y-axis, blue) across the various tissues (X-axis). Similar graphs for (B) H3ac and (C) H3K4me3.

References

    1. Aitola M.H., Pelto-Huikko M.T., Pelto-Huikko M.T. Expression of Arnt and Arnt2 mRNA in developing murine tissues. J. Histochem. Cytochem. 2003;51:41–54. - PubMed
    1. Alberts B., Johnson A., Lewis J., Raff M., Roberts K., Walter P., Johnson A., Lewis J., Raff M., Roberts K., Walter P., Lewis J., Raff M., Roberts K., Walter P., Raff M., Roberts K., Walter P., Roberts K., Walter P., Walter P. Molecular biology of the cell. Garland Publishing; New York: 2002.
    1. Alfano G., Vitiello C., Caccioppoli C., Caramico T., Carola A., Szego M.J., McInnes R.R., Auricchio A., Banfi S., Vitiello C., Caccioppoli C., Caramico T., Carola A., Szego M.J., McInnes R.R., Auricchio A., Banfi S., Caccioppoli C., Caramico T., Carola A., Szego M.J., McInnes R.R., Auricchio A., Banfi S., Caramico T., Carola A., Szego M.J., McInnes R.R., Auricchio A., Banfi S., Carola A., Szego M.J., McInnes R.R., Auricchio A., Banfi S., Szego M.J., McInnes R.R., Auricchio A., Banfi S., McInnes R.R., Auricchio A., Banfi S., Auricchio A., Banfi S., Banfi S. Natural antisense transcripts associated with genes involved in eye development. Hum. Mol. Genet. 2005;14:913–923. - PubMed
    1. Ambros V. The functions of animal microRNAs. Nature. 2004;431:350–355. - PubMed
    1. Apone S., Hauschka S.D., Hauschka S.D. Muscle gene E-box control elements. Evidence for quantitatively different transcriptional activities and the binding of distinct regulatory factors. J. Biol. Chem. 1995;270:21420–21427. - PubMed

Publication types