

In vivo multiphoton microscopy of NADH and FAD redox states, fluorescence lifetimes, and cellular morphology in precancerous epithelia
- PMID: 18042710
- PMCID: PMC2148317
- DOI: 10.1073/pnas.0708425104
In vivo multiphoton microscopy of NADH and FAD redox states, fluorescence lifetimes, and cellular morphology in precancerous epithelia
Abstract
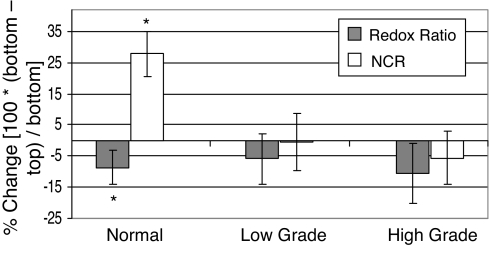
Metabolic imaging of the relative amounts of reduced NADH and FAD and the microenvironment of these metabolic electron carriers can be used to noninvasively monitor changes in metabolism, which is one of the hallmarks of carcinogenesis. This study combines cellular redox ratio, NADH and FAD lifetime, and subcellular morphology imaging in three dimensions to identify intrinsic sources of metabolic and structural contrast in vivo at the earliest stages of cancer development. There was a significant (P < 0.05) increase in the nuclear to cytoplasmic ratio (NCR) with depth within the epithelium in normal tissues; however, there was no significant change in NCR with depth in precancerous tissues. The redox ratio significantly decreased in the less differentiated basal epithelial cells compared with the more mature cells in the superficial layer of the normal stratified squamous epithelium, indicating an increase in metabolic activity in cells with increased NCR. However, the redox ratio was not significantly different between the superficial and basal cells in precancerous tissues. A significant decrease was observed in the contribution and lifetime of protein-bound NADH (averaged over the entire epithelium) in both low- and high-grade epithelial precancers compared with normal epithelial tissues. In addition, a significant increase in the protein-bound FAD lifetime and a decrease in the contribution of protein-bound FAD are observed in high-grade precancers only. Increased intracellular variability in the redox ratio, NADH, and FAD fluorescence lifetimes were observed in precancerous cells compared with normal cells.
Conflict of interest statement
The authors declare no conflict of interest.
Figures


References
-
- Gulledge CJ, Dewhirst MW. Anticancer Res. 1996;16:741–749. - PubMed
-
- Drezek R, Brookner C, Pavlova I, Boiko I, Malpica A, Lotan R, Follen M, Richards-Kortum R. Photochem Photobiol. 2001;73:636–641. - PubMed
-
- Ramanujam N, Kortum RR, Thomsen S, Jansen AM, Follen M, Chance B. Opt Express. 2001;8:335–343. - PubMed
-
- Zhang Z, Li H, Liu Q, Zhou L, Zhang M, Luo Q, Glickson J, Chance B, Zheng G. Biosens Bioelectron. 2004;20:643–650. - PubMed
-
- Alberts B, Johnson A, Lewis J, Raff M, Roberts K, Walter P. Mol Biol Cell. New York: Garland Science; 2002.
Publication types
MeSH terms
Substances
Grants and funding
LinkOut - more resources
Full Text Sources
Other Literature Sources
Medical
