. 2008 Feb 15;111(4):2101-11.
doi: 10.1182/blood-2007-06-096297. Epub 2007 Nov 27.

IL-7 promotes Glut1 trafficking and glucose uptake via STAT5-mediated activation of Akt to support T-cell survival

Affiliations

IL-7 promotes Glut1 trafficking and glucose uptake via STAT5-mediated activation of Akt to support T-cell survival

Jessica A Wofford et al. Blood. .

Abstract

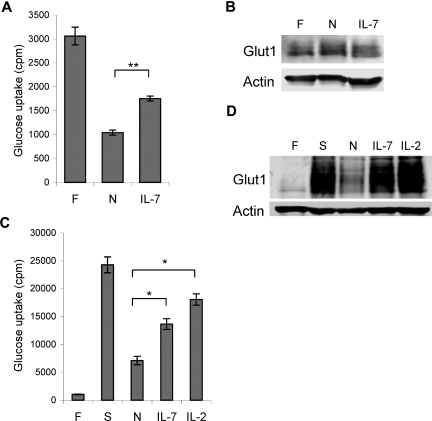
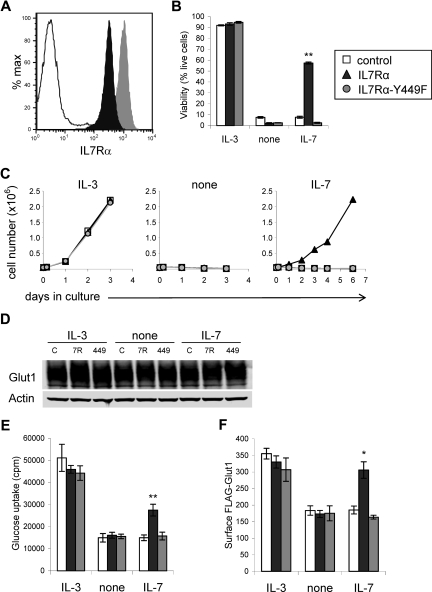
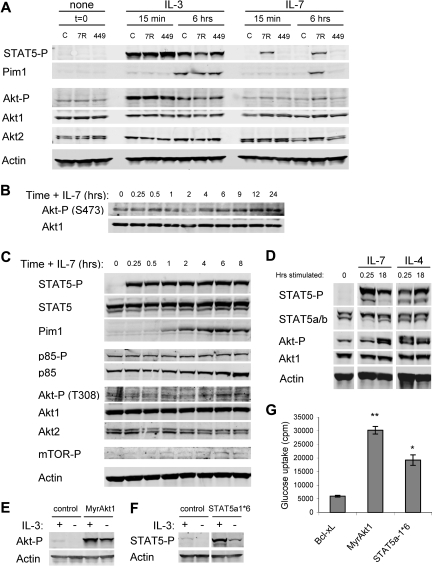
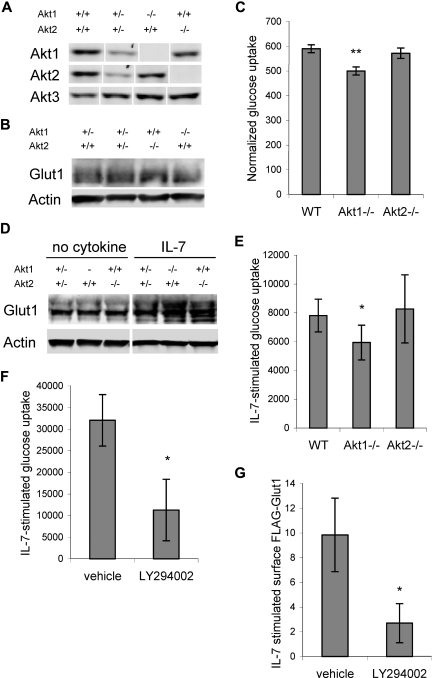
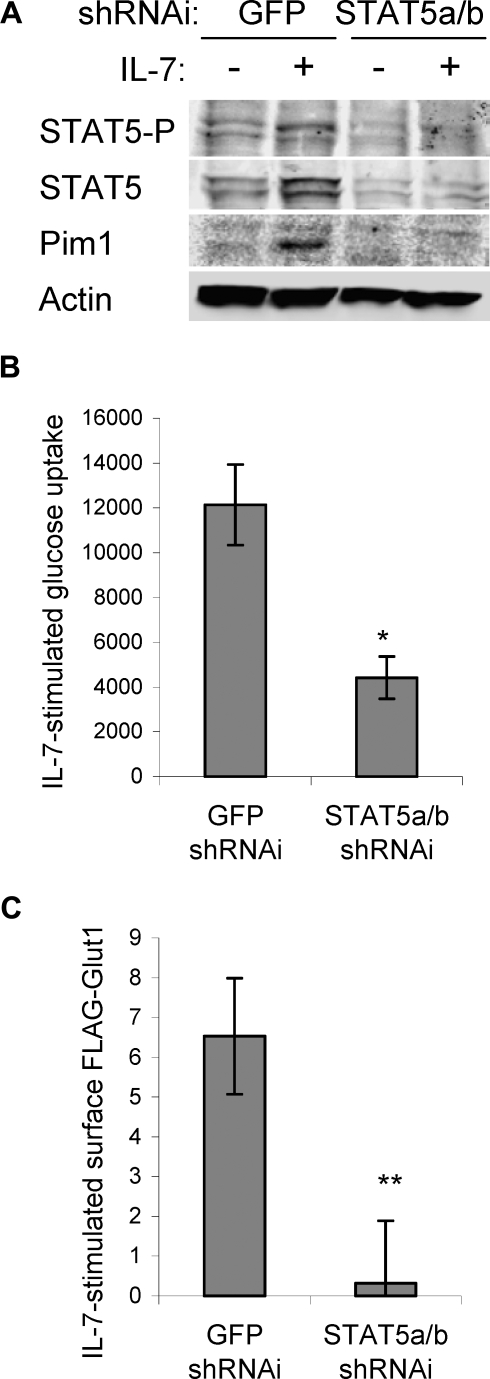
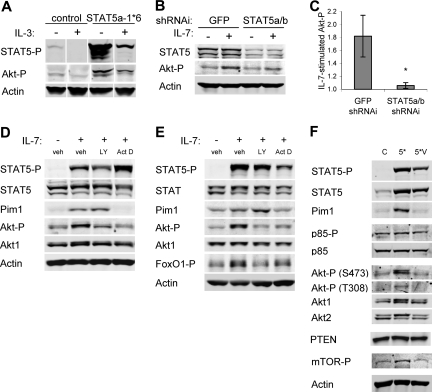
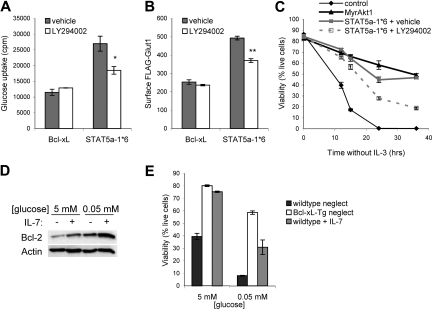
Lymphocyte homeostasis requires coordination of metabolic processes with cellular energetic and biosynthetic demands but mechanisms that regulate T-cell metabolism are uncertain. We show that interleukin-7 (IL-7) is a key regulator of glucose uptake in T lymphocytes. To determine how IL-7 affects glucose uptake, we analyzed IL-7 signaling mechanisms and regulation of the glucose transporter, Glut1. The IL-7 receptor (IL-7R) stimulated glucose uptake and cell-surface localization of Glut1 in a manner that required IL-7R Y449, which promoted rapid signal transducer and activator of transcription 5 (STAT5) activation and a delayed yet sustained activation of Akt. Each pathway was necessary for IL-7 to promote glucose uptake, as Akt1(-/-) T cells or PI3-kinase inhibition and RNAi of STAT5 led to defective glucose uptake in response to IL-7. STAT5 and Akt acted in a linear pathway, with STAT5-mediated transcription leading to Akt activation, which was necessary for STAT5 and IL-7 to promote glucose uptake and prevent cell death. Importantly, IL-7 required glucose uptake to promote cell survival. These data demonstrate that IL-7 promotes glucose uptake via a novel signaling mechanism in which STAT5 transcriptional activity promotes Akt activation to regulate Glut1 trafficking and glucose uptake that is critical for IL-7 to prevent T-cell death and maintain homeostasis.


Figures

Figure 1
Figure 1
IL-7 regulates glucose uptake in naive and activated T cells. (A,B) T cells were analyzed immediately after purification (F) or after culture overnight without stimulation (N) or in IL-7 for (A) glucose uptake and (B) Glut1 protein levels. (C,D) T cells were analyzed freshly isolated (F) and after stimulation with anti-CD3 and anti-CD28 (S), then neglect (N), IL-7, or IL-2 for (C) glucose uptake and (D) Glut1 protein levels. Values represent means plus or minus the standard error of the mean (SEM) of triplicate samples. By Student t test, *P < .03, **P < .001.
Figure 2
Figure 2
Expression of IL-7Rα, but not IL-7Rα–Y449F, allows IL-7 to support cell survival, growth, glucose uptake, and surface Glut1 in cytokine-dependent cells. FL5.12 cells were transduced with control, wild-type IL-7Rα, or IL-7Rα–Y449F expression plasmids and stable clones were isolated for analysis. (A) Surface IL-7Rα levels were determined by flow cytometry. (B-E) Control, IL-7Rα–, and IL-7Rα-Y449F–expressing cells were washed and cultured in IL-3, no cytokine (none), or IL-7, and observed for (B) cell viability after one day, (C) cell growth over time, (D) Glut1 protein levels, and (E) glucose uptake after 8 hours. (F) Regulation of surface Glut1 trafficking was determined by transfecting control, IL-7Rα–, and IL-7Rα-Y449F–expressing cells with exofacially FLAG-tagged Glut1 (FLAG-Glut1). Cells were washed and cultured in IL-3, no cytokine (none), or IL-7 for 8 hours and surface FLAG-Glut1 was determined by flow cytometry. Values represent means plus or minus SEM of triplicate samples. By Student t test, *P < .02, **P < .001.
Figure 3
Figure 3
IL-7 leads to rapid STAT5 activation yet delayed and sustained Akt activation, both of which promote glucose uptake. (A) Control (C), IL-7Rα (7R)–, and IL-7Rα-Y449F (449)–expressing FL5.12 cells were washed and cultured without cytokine (t = 0) and then stimulated with IL-3 or IL-7 for 15 minutes or 6 hours. Cell lysates were analyzed by immunoblot for phospho-STAT5 (Y694), Pim1, phospho-Akt (S473), Akt1, Akt2, and Actin. (B, C) IL-7Rα cells were washed and cultured without cytokine for 6 hours, then stimulated with IL-7 for 15 minutes to 24 hours. Cell lysates were analyzed by immunoblot for (B) phospho-Akt (S473) and Akt1 and (C) phospho-STAT5 (Y694), STAT5, Pim1, phospho-p85 (Y458), p85α, phospho-Akt (T308), Akt1, Akt2, phosho-mTOR (S2448), and Actin. (D) Purified primary T cells were analyzed without stimulation or after culture for 15 minutes or 18 hours with IL-7 or IL-4. Cell lysates were analyzed by immunoblot for phospho-STAT5 (Y694), total STAT5, phospho-Akt (S473), Akt1, and Actin. (E,F) FL5.12 cells were transfected with Bcl-xL as a control, MyrAkt1, or STAT5a-1*6 expression plasmids, cultured with or without IL-3 for 10 hours, and analyzed for (E) phospho-Akt and (F) phospho-STAT5 and Actin. Note that short exposures are shown to illustrate levels of phosphorylation in constitutively active proteins. (G) One day after transfection, Bcl-xL, MyrAkt1, or STAT5a-1*6 transfected cells were cultured in the absence of cytokine for 14 hours and glucose uptake was measured. Values represent means plus or minus SEM of triplicate samples within the given experiment. By Student t test, *P < .005, **P < .001. White vertical lines have been inserted to indicate repositioned gel lanes in panels D and F.
Figure 4
Figure 4
Akt is required for maximal IL-7–stimulated glucose uptake. (A-C) T cells were purified from control, Akt1-, and Akt2-deficient mice and analyzed for (A) Akt isoform expression, (B) Glut1 protein levels by immunoblot, and (C) glucose uptake. (D,E) Purified T cells from wild-type, Akt1-, and Akt2-deficient mice were stimulated with anti-CD3 and anti-CD28 with IL-2 for 2 days, cultured in IL-2 alone for 1 day, then washed and neglected or cultured in IL-7 for an additional day. (D) Glut1 protein levels were determined by immunoblot and (E) IL-7–stimulated glucose uptake (treated − untreated, the difference in uptake + IL-7 above uptake in untreated cells) was measured. (F) IL-7Rα–expressing FL5.12 cells that expressed Bcl-xL to maintain cell viability were washed and cultured without cytokine or with IL-7 in DMSO (vehicle) or LY294002. Glucose uptakes were measured after 14 hours and IL-7–stimulated glucose uptakes are shown. (G) FLAG-Glut1 was transfected into IL-7Rα–expressing FL5.12 cells that expressed Bcl-xL to maintain cell viability. One day after transfection, cells were washed and cultured without cytokine or with IL-7 in DMSO (vehicle) or LY294002 for an additional 14 hours and surface FLAG-Glut1 was determined. Values represent averages from 5 (C) and 4 (E) independent experiments. IL-7–stimulated glucose uptake and FLAG-Glut1 levels were determined using triplicate unstimulated and stimulated samples. Values represent means plus or minus SEM of multiple experiments (C,E) or triplicate samples within the given experiment (F,G). By Student t test, *P < .05, **P < .005. White vertical lines have been inserted to indicate repositioned gel lanes in panels A and D.
Figure 5
Figure 5
STAT5 is required for maximal IL-7–stimulated glucose uptake and surface Glut1 levels. IL-7Rα–expressing FL5.12 cells that expressed Bcl-xL to maintain cell viability were transfected with control (shGFP) or STAT5a/b shRNAi and cultured for 30 hours, washed, and cultured in the absence or presence of IL-7 for an additional 14 hours. (A) STAT5, phospho-STAT5 (Y694), and Pim1 were analyzed by immunoblot. (B) IL-7–stimulated glucose uptake (treated − untreated) was measured. (C) FLAG-Glut1 was cotransfected with control or STAT5a/b shRNAi and IL-7–stimulated FLAG-Glut1 level was determined by flow cytometry. Values represent means plus or minus SEM of triplicate samples within the given experiment. By Student t test, *P < .009, **P < .001.
Figure 6
Figure 6
STAT5 regulation of Akt activation requires STAT5-activated transcription. (A) Cells were transfected with control or STAT5a-1*6 expression plasmids and cultured overnight. Cells were then washed and cultured with or without IL-3 for an additional 8 hours and cell lysates were immunoblotted for phospho-STAT5, phospho-Akt, and Actin. (B,C) IL-7Rα–expressing FL5.12 cells that expressed Bcl-xL to maintain cell viability were transfected with control (GFP) or STAT5a/b shRNAi and cultured for 30 hours, washed, and cultured in the absence or presence of IL-7 for an additional 14 hours. (B) STAT5, phospho-Akt, and Actin were observed by immunoblot. (C) Phospho-Akt/Actin ratios were quantitated from untreated and IL-7–treated samples from 4 independent experiments to determine IL-7–stimulated phospho-Akt in control and STAT5a/b shRNAi treated cells. (D) IL-7Rα–expressing FL5.12 cells were washed and cultured without cytokine for 6 hours, treated with DMSO (vehicle), LY294002, or actinomycin D for 30 minutes, and stimulated with IL-7 for 8 hours. (E) T cells were treated with DMSO (vehicle), LY294002, or actinomycin D for 30 minutes, and stimulated with IL-7 for 8 hours. (D,E) Cell lysates were analyzed by immunoblot for phospho-STAT5 (Y659), STAT5, Pim1, phospho-Akt (S473), Akt1, phospho-FoxO1/FoxO3a (T24/T32), and Actin. (F) Cells were transfected with control (C), STAT5a-1*6 (5*), or STAT5a-1*6-VVV (5*V) expression plasmids and cultured overnight. Cells were then washed and cultured in the absence of cytokine for 9 hours. Cell lysates were analyzed by immunoblot for phospho-STAT5 (Y694), STAT5, Pim1, phospho-p85 (Y458), p85α, phospho-Akt (T308), Akt1, Akt2, PTEN phospho-mTOR (S2448), and Actin. Values represent means plus or minus SEM from 4 independent experiments. By Student t test, *P < .05. White vertical lines have been inserted to indicate repositioned gel lanes in panel A.
Figure 7
Figure 7
IL-7–mediated survival requires glucose and depends on STAT5 regulation of Akt. (A,B) Bcl-xL (control) and STAT5a-1*6 expression vectors were transfected into (A) FL5.12 cells and (B) FLAG-Glut1–expressing cells. One day after transfection, cells were washed and cultured in the absence of cytokine with DMSO (vehicle) or LY294002 for an additional 14 hours, and (A) glucose uptake and (B) surface FLAG-Glut1 were determined. (C) FL5.12 cells were transfected with control, MyrAkt1, or STAT5a-1*6 expression plasmids, withdrawn from IL-3 in the presence of absence of LY294002, and cell viability was observed over time. (D,E) Nontransgenic or Bcl-xL–transgenic T cells were purified and neglected or cultured in IL-7 in media with 5 mM or 0.05 mM glucose. (D) Bcl-2 protein levels in nontransgenic T cells and (E) cell viability in nontransgenic (wild type) and Bcl-xL–transgenic T cells were observed after one day. Values represent means plus or minus SEM of triplicate samples. By Student t test, *P < .02, **P < .005.

References

    1. Jameson SC. Maintaining the norm: T-cell homeostasis. Nat Rev Immunol. 2002;2:547–556. - PubMed
    1. Raff MC. Social controls on cell survival and cell death. Nature. 1992;356:397–400. - PubMed
    1. Boyman O, Purton JF, Surh CD, Sprent J. Cytokines and T-cell homeostasis. Curr Opin Immunol. 2007;19:320–326. - PubMed
    1. Rathmell JC, Vander Heiden MG, Harris MH, Frauwirth KA, Thompson CB. In the absence of extrinsic signals, nutrient utilization by lymphocytes is insufficient to maintain either cell size or viability. Mol Cell. 2000;6:683–692. - PubMed
    1. Vander Heiden MG, Plas DR, Rathmell JC, Fox CJ, Harris MH, Thompson CB. Growth factors can influence cell growth and survival through effects on glucose metabolism. Mol Cell Biol. 2001;21:5899–5912. - PMC - PubMed

Publication types