

A biological model for influenza transmission: pandemic planning implications of asymptomatic infection and immunity
- PMID: 18043733
- PMCID: PMC2080757
- DOI: 10.1371/journal.pone.0001220
A biological model for influenza transmission: pandemic planning implications of asymptomatic infection and immunity
Abstract
Background: The clinical attack rate of influenza is influenced by prior immunity and mixing patterns in the host population, and also by the proportion of infections that are asymptomatic. This complexity makes it difficult to directly estimate R(0) from the attack rate, contributing to uncertainty in epidemiological models to guide pandemic planning. We have modelled multiple wave outbreaks of influenza from different populations to allow for changing immunity and asymptomatic infection and to make inferences about R(0).
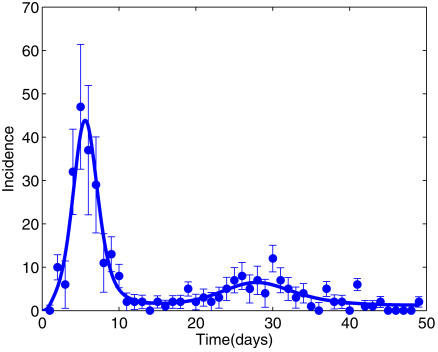
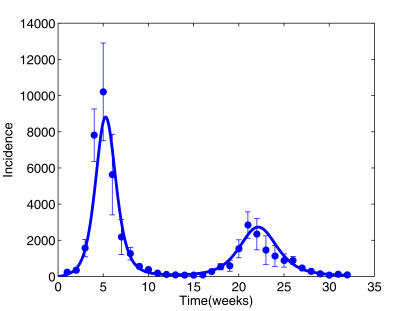
Data and methods: On the island of Tristan da Cunha (TdC), 96% of residents reported illness during an H3N2 outbreak in 1971, compared with only 25% of RAF personnel in military camps during the 1918 H1N1 pandemic. Monte Carlo Markov Chain (MCMC) methods were used to estimate model parameter distributions.
Findings: We estimated that most islanders on TdC were non-immune (susceptible) before the first wave, and that almost all exposures of susceptible persons caused symptoms. The median R(0) of 6.4 (95% credibility interval 3.7-10.7) implied that most islanders were exposed twice, although only a minority became ill in the second wave because of temporary protection following the first wave. In contrast, only 51% of RAF personnel were susceptible before the first wave, and only 38% of exposed susceptibles reported symptoms. R(0) in this population was also lower [2.9 (2.3-4.3)], suggesting reduced viral transmission in a partially immune population.
Interpretation: Our model implies that the RAF population was partially protected before the summer pandemic wave of 1918, arguably because of prior exposure to interpandemic influenza. Without such protection, each symptomatic case of influenza would transmit to between 2 and 10 new cases, with incidence initially doubling every 1-2 days. Containment of a novel virus could be more difficult than hitherto supposed.
Conflict of interest statement
Figures
References
-
- Ministry of Health. London, England: His Majesty's Stationery Office; 1920. Pandemic of Influenza 1918–9, Reports on Public Health and Medical Subjects No4, Available: http://influenza.sph.unimelb.edu.au. Accessed: 30 August 2006.
-
- Crosby A. Cambridge, UK: Cambridge University Press; 2003. Chapter 12. Samoa and Alaska. America's Forgotten Pandemic The influenza of 1918.
-
- Nicholson K, Webster R, Hay A. Oxford: Blackwell Science; 1998. Textbook of influenza.
-
- Davis L, Caldwell G, Lynch R, Bailey R, Chin T. Hong Kong influenza: the epidemiologic features of a high school family study analyzed and compared with a similar study during the 1957 Asian influenza epidemic. Am J Epidemiol. 1970;92:240–247. - PubMed
Publication types
MeSH terms
LinkOut - more resources
Full Text Sources
Medical
Research Materials
Miscellaneous
