. 2007 Nov 28;2(11):e1233.
doi: 10.1371/journal.pone.0001233.

Acute sleep deprivation and circadian misalignment associated with transition onto the first night of work impairs visual selective attention

Affiliations

Acute sleep deprivation and circadian misalignment associated with transition onto the first night of work impairs visual selective attention

Nayantara Santhi et al. PLoS One. .

Abstract

Background: Overnight operations pose a challenge because our circadian biology promotes sleepiness and dissipates wakefulness at night. Since the circadian effect on cognitive functions magnifies with increasing sleep pressure, cognitive deficits associated with night work are likely to be most acute with extended wakefulness, such as during the transition from a day shift to night shift.

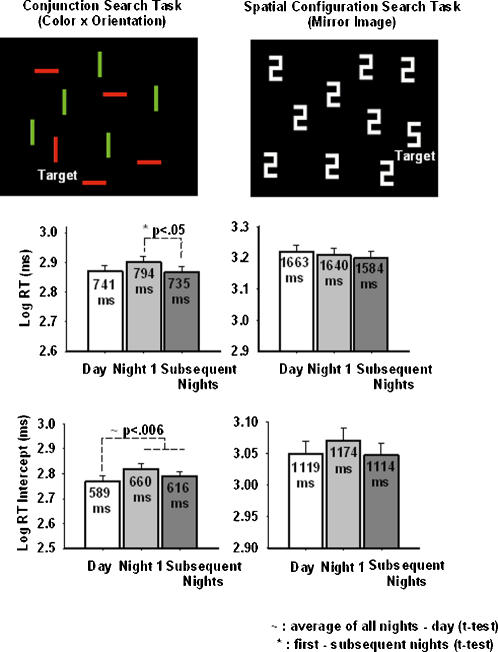
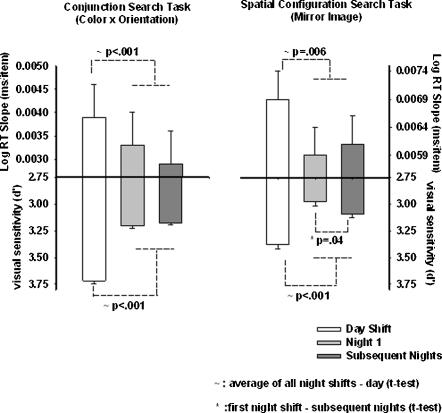
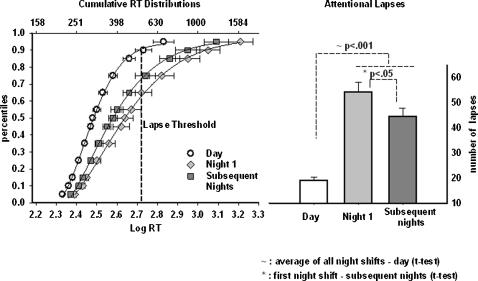
Methodology/principal findings: To test this hypothesis we measured selective attention (with visual search), vigilance (with Psychomotor Vigilance Task [PVT]) and alertness (with a visual analog scale) in a shift work simulation protocol, which included four day shifts followed by three night shifts. There was a nocturnal decline in cognitive processes, some of which were most pronounced on the first night shift. The nighttime decrease in visual search sensitivity was most pronounced on the first night compared with subsequent nights (p = .04), and this was accompanied by a trend towards selective attention becoming 'fast and sloppy'. The nighttime increase in attentional lapses on the PVT was significantly greater on the first night compared to subsequent nights (p<.05) indicating an impaired ability to sustain focus. The nighttime decrease in subjective alertness was also greatest on the first night compared with subsequent nights (p<.05).

Conclusions/significance: These nocturnal deficits in attention and alertness offer some insight into why occupational errors, accidents, and injuries are pronounced during night work compared to day work. Examination of the nighttime vulnerabilities underlying the deployment of attention can be informative for the design of optimal work schedules and the implementation of effective countermeasures for performance deficits during night work.


Conflict of interest statement

Competing Interests: Potential competing interests for all authors are fully detailed in the Acknowledgments section.

Figures

Figure 1
Figure 1. Stimuli and Response Time Data from the Visual Search Tasks.
The top panels show a representative target present trial in the two search tasks. The top left panel shows a conjunction search trial where the target is a red vertical bar and the distractors, green vertical and red horizontal bars. The top right panel shows a spatial configuration search trial where the target a white block numeral ‘5’, and the distractors, the mirror image white block numeral ‘2s’. The middle and lower panels show the log transformed RT and the RT x set size intercept results. In the middle and lower panels, the x-axis represents the work shift. In the middle panels the y-axis represents RT and in the bottom panels it represents the RT intercept, both in log units. The error bars represent the standard error of the mean. The day shift (baseline) data are shown in the white bar and represent the average of the third and fourth day shifts (the first two shifts were excluded to minimize practice effects; see text for details); night 1 data are shown in the light gray bar; data from the ‘subsequent’ nights are shown in the dark gray bar, and represent the average of the second and third night shifts. The middle panels show RT data from the two search tasks. As seen in the left panel, RT was slowest on the night 1 in the conjunction search task, while the right panel indicates that this slowing did not occur in the spatial configuration search task. The lower panels show RT x set size intercept data from the two search tasks. As seen in the left panel RT intercept during night work was significantly slower than during day work in the conjunction search task (t-tests).
Figure 2
Figure 2. Speed/Accuracy Trade Off in Selective Attention.
The data in this figure represent the slopes of the RT x set size function (index of selective attention) in log units and d' (an index of sensitivity reflecting accuracy) in the visual search tasks. The error bars represent the standard error of the mean. As in figure 1 the x-axis represents the work shift. In the upper part of the figure the y-axis represents RT slope in (msecs per additional item). In both search tasks, the decreasing values of RT slope during night work suggest that there was either a speed-up in search with increasing number of items or there was a failure in processing information arising from nocturnal cognitive impairment. In the lower part of the figure the y-axis represents d'. Decreasing values of d' during night work in both search tasks indicate a loss of accuracy. In the spatial configuration search task (right panel) this loss of accuracy was greatest on the first night shift. Together the results presented in this figure suggest a speed-error trade-off on the night shifts, indicating that participants either failed to collect sufficient information or there was a failure in processing information arising from nocturnal cognitive impairment.
Figure 3
Figure 3. The Impact of Night Work on Vigilance RT and Attentional Lapses.
This figure presents results from the PVT task. The left panel represents the group-averaged cumulative response time (RT) percentile distribution. The x-axis represents response time with the bottom x-axis in log units and the top x-axis in milliseconds. The error bars represent the standard error of the mean. The dashed vertical line is plotted at the average attentional lapse threshold (90th percentile of baseline RT). The y-axis represents percentile points. The average cumulative distributions were computed by calculating the RT percentiles for the day (open circles), first night shift (filled diamond) and ‘subsequent’ night shifts (filled square) for each individual subject, and then averaging them across subjects to compute the final cumulative distributions. For each of the shifts, these cumulative distributions were fitted with a 4-parameter Weibull function. The right panel presents the number of attentional lapses on the three shifts. The error bars represent the standard error of the mean. There was a significant increase in lapses during night work, and this was most pronounced on the first night shift.

References

    1. Czeisler CA, Dijk DJ. Use of bright light to treat maladaption to night shift work and circadian rhythm sleep disorders. J Sleep Res. 1995;4:70–73. - PubMed
    1. Horowitz TS, Cade BE, Wolfe JM, Czeisler CA. Efficacy of bright light and sleep/darkness scheduling in alleviating circadian maladaptation to night work. Am J Physiol Endocrinol Metab. 2001;281:E384–E391. - PubMed
    1. Dijk DJ, Duffy JF, Czeisler CA. Circadian and sleep/wake dependent aspects of subjective alertness and cognitive performance. J Sleep Res. 1992;1:112–117. - PubMed
    1. Jewett ME, Kronauer RE. Interactive mathematical models of subjective alertness and cognitive throughput in humans. J Biol Rhythms. 1999;14:588–597. - PubMed
    1. Barger LK, Cade BE, Ayas NT, Cronin JW, Rosner B, et al. Extended work shifts and the risk of motor vehicle crashes among interns. N Engl J Med. 2005;352:125–134. - PubMed

Publication types