. 2007 Nov 28;2(11):e1242.
doi: 10.1371/journal.pone.0001242.

Physical analyses of E. coli heteroduplex recombination products in vivo: on the prevalence of 5' and 3' patches

Affiliations

Physical analyses of E. coli heteroduplex recombination products in vivo: on the prevalence of 5' and 3' patches

Laura M Gumbiner-Russo et al. PLoS One. .

Abstract

Background: Homologous recombination in Escherichia coli creates patches (non-crossovers) or splices (half crossovers), each of which may have associated heteroduplex DNA. Heteroduplex patches have recombinant DNA in one strand of the duplex, with parental flanking markers. Which DNA strand is exchanged in heteroduplex patches reflects the molecular mechanism of recombination. Several models for the mechanism of E. coli RecBCD-mediated recombinational double-strand-end (DSE) repair specify that only the 3'-ending strand invades the homologous DNA, forming heteroduplex in that strand. There is, however, in vivo evidence that patches are found in both strands.

Methodology/principle findings: This paper re-examines heteroduplex-patch-strand polarity using phage lambda and the lambdadv plasmid as DNA substrates recombined via the E. coli RecBCD system in vivo. These DNAs are mutant for lambda recombination functions, including orf and rap, which were functional in previous studies. Heteroduplexes are isolated, separated on polyacrylamide gels, and quantified using Southern blots for heteroduplex analysis. This method reveals that heteroduplexes are still found in either 5' or 3' DNA strands in approximately equal amounts, even in the absence of orf and rap. Also observed is an independence of the RuvC Holliday-junction endonuclease on patch formation, and a slight but statistically significant alteration of patch polarity by recD mutation.

Conclusions/significance: These results indicate that orf and rap did not contribute to the presence of patches, and imply that patches occurring in both DNA strands reflects the molecular mechanism of recombination in E. coli. Most importantly, the lack of a requirement for RuvC implies that endonucleolytic resolution of Holliday junctions is not necessary for heteroduplex-patch formation, contrary to predictions of all of the major previous models. This implies that patches are not an alternative resolution of the same intermediate that produces splices, and do not bear on models for splice formation. We consider two mechanisms that use DNA replication instead of endonucleolytic resolution for formation of heteroduplex patches in either DNA strand: synthesis-dependent-strand annealing and a strand-assimilation mechanism.


Conflict of interest statement

Competing Interests: The authors have declared that no competing interests exist.

Figures

Figure 1
Figure 1. Previous models for RecBCD-mediated recombination in E. coli.
RecBCD (notched circle) loads onto a double-strand end (DSE), depicted here as the right end of the phage λ chromosome, the left end being occluded during packaging by terminase and the packaging proteins (depicted as an octagon) . (A) The nick-at Chi model , suggested that RecBCD unwinds and rewinds the DNA until it encounters Chi, at which point it nicks the 3′-ending strand which invades a homologous duplex DNA molecule (red), creating patches exclusively in the 3′-ending strand. (B) The split-end model proposed that RecBCD degrades both strands until an encounter with Chi, effectively translocating the DSE to the Chi site. At Chi, RecBCD was proposed to lose its nuclease activity, retain helicase activity, and unwind the DNA. This split-end intermediate might be acted on by single-strand-dependent exonucleases of one polarity or the other, creating single-strand ends of either polarity that could invade a homologous duplex DNA molecule . 5′-end invasions were proposed to lead to 5′ patches, and 3′-end invasions to lead to 3′ patches. (C) The asymmetric DNA degradation model incorporates the proposal of that RecBCD degrades one or both (depicted here) DNA strands until an encounter with Chi, at which point this model specifies that the nuclease activity is altered and only the 5′-ending strand is degraded. This creates a 3′ end that invades a homologous duplex DNA molecule leading to patches exclusively in the 3′-ending strand. All of these models include endonucleolytic resolution of the strand-exchange intermediate, such as a Holliday junction (HJ), as the final step, a prediction that has been upheld for “break-join” splices , , but that will be called into question for patch formation by data presented below. We will suggest that none of these models can explain patch formation and consider alternatives. DNA ends with a half arrowhead represent 3′ ends, and plain ends represent 5′ ends.
Figure 2
Figure 2. Separation of heteroduplexes by polyacrylamide gel electrophoresis.
Southern blot of artificial heteroduplexes, made by melting and reannealing the 604 bp long DNA fragment with and without an 18 bp insertion marker, run on a 5% polyacrylamide gel. (A) Hybridization of the blot with a PCR-labeled probe complementary to the entire 604 bp restriction fragment. (B) Hybridization with an oligo probe complementary to the loop sequence in the strand ending 5′ at the right. (C) Hybridization with an oligo probe complementary to the loop sequence in the 3′-ending strand. “+”, the homoduplex fragment containing the 18 bp insert; “-”, the homoduplex fragment with no insert; “mixed”, melted and reannealed “+” and “−” DNAs (artificially prepared heteroduplexes). Figures beneath the gels represent the structures of Homo- and Het-containing fragments, showing the sequences of the complementary loops. “Het”, heteroduplex; “Homo”, homoduplex.
Figure 3
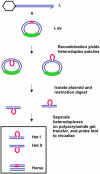
Figure 3. Strategy for heteroduplex analysis of patches formed in vivo in λ by λdv “crosses”.
Red, 18 nt insertion marker; green box, region of the λdv plasmid DNA that is not homologous with λ; blue parallel lines, strands of DNA; hexagon, phage λ capsid and packaging proteins which bind the λ chromosome left end during cleavage of λ DNA for packaging. This leaves only the right end free for RecBCD-initiated recombination .
Figure 4
Figure 4. Heteroduplex patches are formed in vivo, RecA- and RecB-dependently.
(A) Heteroduplexes are formed in vivo. Lanes labeled “wild-type” are two different amounts of DNA from a rec + cross (SMR6726×λSR542), lanes labeled “mock cross 1–3” contain two different amounts of DNA from each of three mock crosses (JC11450×λSR542 mixed with SMR6726 without λ infection, as described in text). The last lane also contains an artificial het control. (B) RecA dependence of het patches. Strains used are: rec + (SMR6726–JC11450 [pLGR5]), recA (SMR10154-JC11450 Δ(srlR-recA)306::Tn10 [pLGR5]), and topB (SMR10207-JC11450 ΔtopB::FRT [pLGR5]) each crossed with λSR542. Numbers above the lanes indicate the relative amounts of DNA loaded (i. e. a lane marked “4” indicates that lane contains four times the amount of DNA than was loaded in the lane marked “1” for the same cross). No het bands are visible for recA on the exposed film, but the scan of the film gives the appearance of bands present. The last lane is an artificial het control. (C) RecB dependence of het patches. Strains used are: rec + as in B., and recB (SMR9579–JC11450 recB21 [pLGR5]). Plasmid controls are artificial het controls as in Figure 2. The homoduplex band was run off of the gel for the control lanes, but because the homoduplex fragment was 50–100x more prevalent in the cross DNAs, the homoduplex band was much broader and the upper portion of that band remained visible.
Figure 5
Figure 5. Prevalence of 5′- and 3′-strand patches is independent of λ Orf and Rap.
(A) For analyses of plasmid DNAs isolated from crosses with the marker in the plasmid, Het I corresponds to a 3′ patch, and Het II corresponds to a 5′ patch. When the marker is in the λ, Het I corresponds to a 5′ patch and Het II to a 3′ patch. Red lines represent the 18 bp marker insert. (B) Plasmid DNAs isolated from orf + rap + crosses. Two crosses are shown. For each set of crosses, the lane marked “pls” denotes that the insertion marker was present in the plasmid (SMR6721×λSR539), and the lane marked “λ” denotes that the marker was present in the λ (FS1607×λSR538). See text for quantification. (C) Plasmid DNAs from orf rap crosses. One cross of each type is shown (marker present in the plasmid [SMR6720×λSR542] or in the λ [SMR6205×λSR543]), and two different amounts of DNA were loaded for each cross. Numbers above the lanes are relative amounts based on the estimated DNA concentration. Plasmid controls, artificial heteroduplexes made by melting and reannealing 604 bp fragments with and without the 18 bp marker insert as for Figure 2. See text for quantification from multiple crosses.
Figure 6
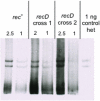
Figure 6. Crosses in a recD strain show a slight 5′ bias in patch polarity.
Lanes marked “rec +” are two different amounts of DNA from a rec + cross (SMR6726×λSR542). Lanes marked “recD cross 1” are two amounts of DNA from a recD cross (SMR10215×λSR542), and lanes marked “recD cross 2” are from a second recD cross. Control het is as for Fig. 2. For all crosses the 18 bp marker was present on the λdv plasmid, (SMR6726-JC11450 [pLGR5], SMR10215-JC11450 recD1903::mini-tet [pLGR5]).
Figure 7
Figure 7. Loss of RuvC does not affect heteroduplex-patch formation.
Strains are from left to right, rec + (SMR6726–JC11450 [pLGR5]), and both ruvC crosses were performed using (SMR10213–JC11450 ΔruvC::FRT [pLGR5]), each infected with λSR542. See text for quantification.
Figure 8
Figure 8. An SDSA model for the formation of 3′ and 5′ patches.
(A) A DSB occurs to the left of the marker. 5′ ends are resected, and one of the resulting 3′ ends invades a homologous duplex. DNA synthesis (dotted lines), strand displacement, and reannealing lead to heteroduplex-patch formation with new DNA in the 3′-ending strand. Only the 3′ end that leads to heteroduplex formation across from the marker is shown. (B) A DSB occurs to the right of the marker. 5′ end resection, strand invasion, DNA synthesis, and reannealing all occur as in A, but result in heteroduplex patch formation with new DNA in the 5′-ending strand. Again, only the 3′ end that leads to heteroduplex formation across from the marker is shown. Adapted from Allers and Lichten .
Figure 9
Figure 9. A single-strand-assimilation model for the formation of 5′ and 3′ patches.
RecBCD loads onto λ at a DSE, and degrades both strands of DNA into ssDNA fragments. When these fragments are present in a cell at the same time as a replicating λdv plasmid (with which some fragments have homology) some of the fragments may be assimilated into the plasmid during replication. Fragments may also form RecA-dependent paranemic joints with the plasmid, as depicted in Leung et al before replication begins. Once a replication fork passes over the region of the joint, the ssDNA fragment will be incorporated into the newly synthesized DNA strand. Fragments that are assimilated across from the 18 bp insert marker (which is not present in the λ phage) will result in a heteroduplex patch at that site. This assimilation might occur with ssDNA from either DNA strand of λ being assimilated across from its complementary DNA in either the leading or lagging strand of a replication fork, creating heteroduplex patches of either polarity (drawn). Adapted from Leung et al. and Ellis et al. ; Court et al. . Alternatively, assimilation might occur preferentially into the lagging strand, as for Red-mediated recombination – (not drawn), but because λdv has no replication terminus, replication might proceed in either direction in vivo, such that both strands are sometimes lagging strands. Thick blue lines represent DNA from the λ molecule, medium blue lines represent DNA from the λdv plasmid, thin blue lines represent newly synthesized λdv DNA, and pink lines represent the 18 bp insert marker. ori indicates the origin of replication for the λdv plasmid, but is not drawn to scale. RecBCD is depicted as in Figure 1, as a notched circle.

Similar articles

Cited by

References

    1. Kowalczykowski SC, Dixon DA, Eggleston AK, Lauder SD, Rehrauer WM. Biochemistry of homologous recombination in Escherichia coli. Microbiol Rev. 1994;58:401–465. - PMC - PubMed
    1. Myers RS, Stahl FW. χ and RecBCD enzyme of Escherichia coli. Annu Rev Genet. 1994;28:49–70. - PubMed
    1. Palas KM, Kushner SR. Biochemical and physical characterization of exonuclease V from Escherichia coli. Comparison of the catalytic activities of the RecBC and RecBCD enzymes. J Biol Chem. 1990;265:3447–3454. - PubMed
    1. Taylor AF, Smith GR. Substrate specificity of the DNA unwinding activity of the RecBC enzyme of Escherichia coli. J Mol Biol. 1985;185:431–443. - PubMed
    1. Ganesan S, Smith GR. Strand-specific binding to duplex DNA ends by the subunits of the Escherichia coli RecBCD enzyme. J Mol Biol. 1993;229:67–78. - PubMed

Publication types