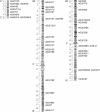
Mosaic genome architecture of the Anopheles gambiae species complex
- PMID: 18043756
- PMCID: PMC2082662
- DOI: 10.1371/journal.pone.0001249
Mosaic genome architecture of the Anopheles gambiae species complex
Abstract
Background: Attempts over the last three decades to reconstruct the phylogenetic history of the Anopheles gambiae species complex have been important for developing better strategies to control malaria transmission.
Methodology: We used fingerprint genotyping data from 414 field-collected female mosquitoes at 42 microsatellite loci to infer the evolutionary relationships of four species in the A. gambiae complex, the two major malaria vectors A. gambiae sensu stricto (A. gambiae s.s.) and A. arabiensis, as well as two minor vectors, A. merus and A. melas.
Principal findings: We identify six taxonomic units, including a clear separation of West and East Africa A. gambiae s.s. S molecular forms. We show that the phylogenetic relationships vary widely between different genomic regions, thus demonstrating the mosaic nature of the genome of these species. The two major malaria vectors are closely related and closer to A. merus than to A. melas at the genome-wide level, which is also true if only autosomes are considered. However, within the Xag inversion region of the X chromosome, the M and two S molecular forms are most similar to A. merus. Near the X centromere, outside the Xag region, the two S forms are highly dissimilar to the other taxa. Furthermore, our data suggest that the centromeric region of chromosome 3 is a strong discriminator between the major and minor malaria vectors.
Conclusions: Although further studies are needed to elucidate the basis of the phylogenetic variation among the different regions of the genome, the preponderance of sympatric admixtures among taxa strongly favor introgression of different genomic regions between species, rather than lineage sorting of ancestral polymorphism, as a possible mechanism.
Conflict of interest statement
Figures


Similar articles
-
A new chromosomal phylogeny supports the repeated origin of vectorial capacity in malaria mosquitoes of the Anopheles gambiae complex.PLoS Pathog. 2012;8(10):e1002960. doi: 10.1371/journal.ppat.1002960. Epub 2012 Oct 4. PLoS Pathog. 2012. PMID: 23055932 Free PMC article.
-
Inversion monophyly in African anopheline malaria vectors.Genetics. 1996 Jul;143(3):1313-20. doi: 10.1093/genetics/143.3.1313. Genetics. 1996. PMID: 8807303 Free PMC article.
-
Genomic analyses of three malaria vectors reveals extensive shared polymorphism but contrasting population histories.Mol Biol Evol. 2014 Apr;31(4):889-902. doi: 10.1093/molbev/msu040. Epub 2014 Jan 9. Mol Biol Evol. 2014. PMID: 24408911 Free PMC article.
-
Molecular identification of chromosomal forms of Anopheles gambiae sensu stricto.Parassitologia. 1999 Sep;41(1-3):115-8. Parassitologia. 1999. PMID: 10697842 Review.
-
Population structure, speciation, and introgression in the Anopheles gambiae complex.Parassitologia. 1999 Sep;41(1-3):101-13. Parassitologia. 1999. PMID: 10697841 Review.
Cited by
-
Coalescent Analysis of Phylogenomic Data Confidently Resolves the Species Relationships in the Anopheles gambiae Species Complex.Mol Biol Evol. 2018 Oct 1;35(10):2512-2527. doi: 10.1093/molbev/msy158. Mol Biol Evol. 2018. PMID: 30102363 Free PMC article.
-
Ecological niche partitioning between Anopheles gambiae molecular forms in Cameroon: the ecological side of speciation.BMC Ecol. 2009 May 21;9:17. doi: 10.1186/1472-6785-9-17. BMC Ecol. 2009. PMID: 19460146 Free PMC article.
-
Molecular and behavioral differentiation among Brazilian populations of Lutzomyia longipalpis (Diptera: Psychodidae: Phlebotominae).PLoS Negl Trop Dis. 2009;3(1):e365. doi: 10.1371/journal.pntd.0000365. Epub 2009 Jan 27. PLoS Negl Trop Dis. 2009. PMID: 19172187 Free PMC article.
-
Evolutionary factors affecting Lactate dehydrogenase A and B variation in the Daphnia pulex species complex.BMC Evol Biol. 2011 Jul 18;11:212. doi: 10.1186/1471-2148-11-212. BMC Evol Biol. 2011. PMID: 21767386 Free PMC article.
-
Ecological and genetic relationships of the Forest-M form among chromosomal and molecular forms of the malaria vector Anopheles gambiae sensu stricto.Malar J. 2009 Apr 21;8:75. doi: 10.1186/1475-2875-8-75. Malar J. 2009. PMID: 19383163 Free PMC article.
References
-
- White GB. Anopheles gambiae complex and disease transmission in Africa. Trans R Soc Trop Med Hyg. 1974;68:278–301. - PubMed
-
- Coluzzi M, Sabatini A, Petrarca V, Di Deco MA. Chromosomal differentiation and adaptation to human environments in the Anopheles gambiae complex. Trans R Soc Trop Med Hyg. 1979;73:483–497. - PubMed
-
- Hunt RH, Coetzee M, Fettene M. The Anopheles gambiae complex: a new species from Ethiopia. Trans R Soc Trop Med Hyg. 1998;92:231–235. - PubMed
-
- Coluzzi M, Sabatini A, della Torre A, Di Deco MA, Petrarca V. A polytene chromosome analysis of the Anopheles gambiae species complex. Science. 2002;298:1415–1418. - PubMed
Publication types
MeSH terms
Substances
Grants and funding
LinkOut - more resources
Full Text Sources

