. 2007 Nov;5(11):e316.
doi: 10.1371/journal.pbio.0050316.

Disruption of state estimation in the human lateral cerebellum

Affiliations

Disruption of state estimation in the human lateral cerebellum

R Chris Miall et al. PLoS Biol. 2007 Nov.

Abstract

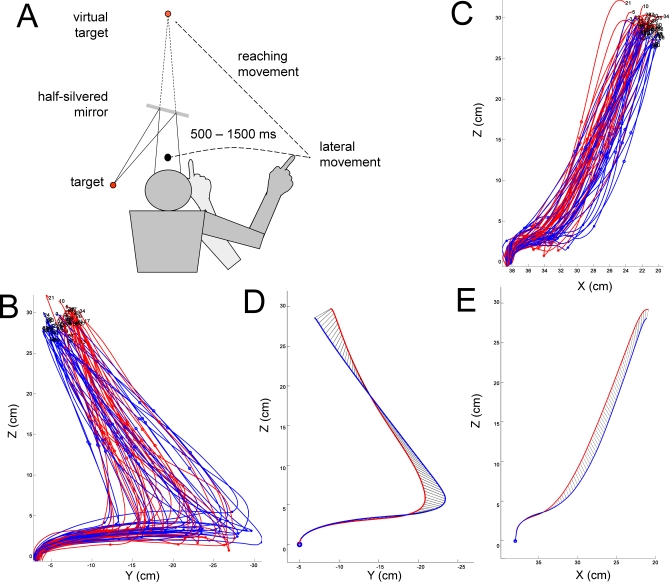
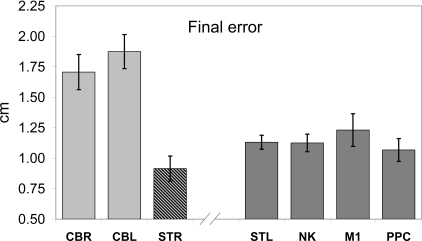
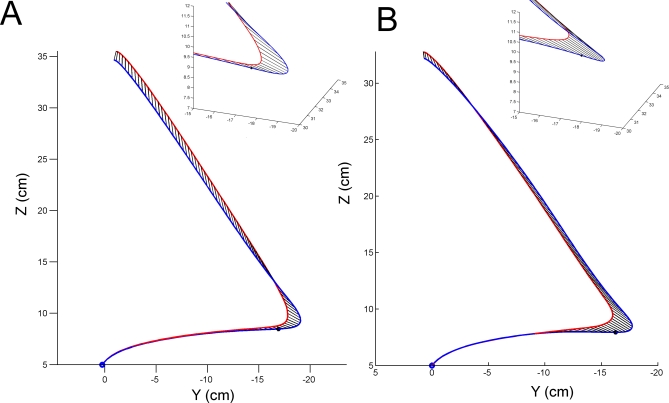
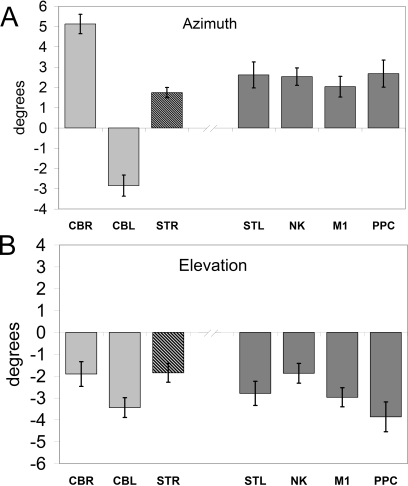
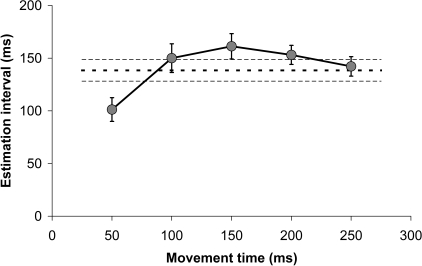
The cerebellum has been proposed to be a crucial component in the state estimation process that combines information from motor efferent and sensory afferent signals to produce a representation of the current state of the motor system. Such a state estimate of the moving human arm would be expected to be used when the arm is rapidly and skillfully reaching to a target. We now report the effects of transcranial magnetic stimulation (TMS) over the ipsilateral cerebellum as healthy humans were made to interrupt a slow voluntary movement to rapidly reach towards a visually defined target. Errors in the initial direction and in the final finger position of this reach-to-target movement were significantly higher for cerebellar stimulation than they were in control conditions. The average directional errors in the cerebellar TMS condition were consistent with the reaching movements being planned and initiated from an estimated hand position that was 138 ms out of date. We suggest that these results demonstrate that the cerebellum is responsible for estimating the hand position over this time interval and that TMS disrupts this state estimate.


Conflict of interest statement

Competing interests. The authors have declared that no competing interests exist.

Figures

Figure 1
Figure 1. The Experimental Task and Typical Single-Participant Data
The experimental task (A), individual trial data (B and C), and session averaged data (D and E) (n = 30 trials) from one typical participant as TMS were applied over the right lateral cerebellum. (B and D) show the finger trajectory viewed from behind and from the right of the subject (C and E). In all panels, TMS trials are plotted in red and non-TMS trials are in blue. Clockwise rotation in (B and D) is defined as increasing azimuth angle; clockwise rotation in (C and E) is defined as decreasing elevation angle.
Figure 2
Figure 2. TMS-Induced Difference in Mean End-Point Error
Each bar is the group mean difference for TMS versus non-TMS trials (+1 SEM). TMS was applied over the cerebellum during rightwards and leftwards movement (CBR, n = 32, CBL, n = 13) and when stationary (STR, n = 9). Control conditions included during startle trials (STL, n = 11), stimulation of the ipsilateral neck (NK, n = 10), the hand area of contralateral primary motor cortex (M1, n = 20), and the contralateral posterior parietal cortex (PPC, n = 12).
Figure 3
Figure 3. Group Mean Trajectories
Group mean trajectories (A) for TMS trials (red) and non-TMS trials (blue) applied over the cerebellum (n = 32). (B) Results from startling TMS or auditory trials, without cerebellar disruption (n = 11). In both panels, the curved path followed from bottom left to right is during the pre-cue period. Shortly after the go cue and TMS, a rapid reach-to-target towards the upper left target position is made. The 3-D inset figures show an expanded view of the reach-to-target initiation. Black dots mark the position on the non-TMS mean trajectory (blue line) from which a similar angular deviation between start and maximum velocity would be found as seen in the TMS trials.
Figure 4
Figure 4. TMS-Induced Difference in Mean Azimuth (A) and Elevation Angles (B)
Each bar is the group mean difference for TMS versus non-TMS trials (+1 SEM); see Figure 2. (A) Positive azimuth angles are defined as clockwise rotations in the frontal plane (see Figure 1B and 1D). (B) Negative elevation angles are defined as clockwise rotations in the sagittal plane (Figure 1C and 1E).
Figure 5
Figure 5. Group Mean Trajectories for TMS Trials (Red) and Non-TMS Trials (Blue) Applied over the Cerebellum (n = 13)
Solid lines indicate stimulation during initial rightwards movement; dotted lines show stimulation during initial leftwards movement. The deviation between between TMS and non-TMS trajectories at the start of the reach towards the final target is reversed between the two conditions, while final errors are similar. The insert at top right is the terminal portion of the trajectories, rotated into the frontal plane. This emphasises the greater overshoot in the z-axis for rightwards TMS trials (red solid lines) compared to leftwards TMS trials (red dotted lines), which mainly overshot in depth (x-axis).
Figure 6
Figure 6. Group Speed Profiles for TMS Trials (Red) and Non-TMS Trials (Blue)
Each panel shows the group average speed profile (±1SEM) for 800 ms after cue onset. The time of TMS stimulation is indicated by the three arrows. (A–D) Startle effects: TMS over cerebellum during rightward movement (A: n = 32); during leftward movement (B: n = 13), or with a stationary start position (C: note zero intial velocity; n = 11) leads to a reduced reaction time and increased peak speed very similar to that induced by startle stimulation (D: with TMS over the ear, n = 4, or with sound stimuli, n = 7). (E–G) Control stimulation sites with TMS over the ipsilateral neck (E: n = 10), contralateral hand area of motor cortex (F: n = 20) or contralateral posterior parietal cortex (G: n = 12); the startle effects are smaller with slighter reduction of reaction time and increase of peak speed.
Figure 7
Figure 7. Sensitivity of the Calculation of Estimation Interval on the Reference Points Chosen to Measure Movement Deviation
The five data points are the mean estimation interval (± SEM, n = 32) calculated at fixed times after movement onset. The dashed line is the mean estimate (±1 SEM) calculated from the point of maximum velocity in each trial.

References

    1. Wolpert DM, Flanagan JR. Motor prediction. Curr Biol. 2001;11:R729–R732. - PubMed
    1. Miall RC, Weir DJ, Stein JF. Visuomotor tracking with delayed visual feedback. Neurosci. 1985;16:511–520. - PubMed
    1. Saunders JA, Knill DC. Humans use continuous visual feedback from the hand to control fast reaching movements. Exp Brain Res. 2003;152:341–352. - PubMed
    1. Desmurget M, Grafton S. Forward modeling allows feedback control for fast reaching movements. Trends Cogn Sci. 2000;4:423–431. - PubMed
    1. Saunders JA, Knill DC. Humans use continuous visual feedback from the hand to control both the direction and distance of pointing movements. Exp Brain Res. 2005;162:458–473. - PubMed

Publication types