

doi: 10.1186/gb-2007-8-11-r253.
Integrative analysis for finding genes and networks involved in diabetes and other complex diseases
Affiliations
- PMID: 18045462
- PMCID: PMC2258178
- DOI: 10.1186/gb-2007-8-11-r253
Item in Clipboard
Integrative analysis for finding genes and networks involved in diabetes and other complex diseases
Genome Biol.
2007.
Abstract
We have developed an integrative analysis method combining genetic interactions, identified using type 1 diabetes genome scan data, and a high-confidence human protein interaction network. Resulting networks were ranked by the significance of the enrichment of proteins from interacting regions. We identified a number of new protein network modules and novel candidate genes/proteins for type 1 diabetes. We propose this type of integrative analysis as a general method for the elucidation of genes and networks involved in diabetes and other complex diseases.
Figures

The strategy used for the current study.

Protein interaction networks for predicted genetic interactions. (a) TNFA-D4S403, TNFA-D13S170 and TNFA-D2S177 are represented by one network, whereas TNFA-D1S229, TNFA-D16S287 and TNFA-D11S910 are represented by two or three networks. Color-code: red, genes from TNFA region; green and yellow, genes from interacting region; light grey, genes from other chromosomes. (b) Protein interaction networks involving D17S798. D17S798-D1S197, D17S798-D2P25 and D17S798-D5S429 are represented by four, three and two networks, respectively. Color-code: red, genes from D17S798-region; blue/green, genes from interacting region; light grey, genes from other chromosomes.
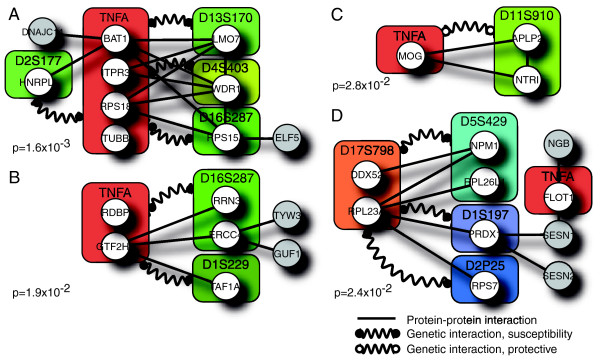
Significant functional modules (modules A-D). Straight lines represent validated protein-protein interactions, curved lines represent demonstrated genetic interactions (black bullets, predictive interactions; white bullets, protective interactions). Circles with gene names represent the gene encoding the protein of the interaction. Boxes are the marker regions shown to be involved in the genetic interactions and in which the genes are located.
Similar articles
-
The type 1 diabetes - HLA susceptibility interactome--identification of HLA genotype-specific disease genes for type 1 diabetes.PLoS One. 2010 Mar 5;5(3):e9576. doi: 10.1371/journal.pone.0009576. PLoS One. 2010. PMID: 20221424 Free PMC article.
-
Epistasis effect: an alternative to the hypothesis of linkage disequilibrium in HLA associated diseases.Ann Hum Genet. 1980 Oct;44(2):195-204. doi: 10.1111/j.1469-1809.1980.tb00958.x. Ann Hum Genet. 1980. PMID: 7316470 No abstract available.
-
Functional relevance for type 1 diabetes mellitus-associated genetic variants by using integrative analyses.Hum Immunol. 2015 Oct;76(10):753-8. doi: 10.1016/j.humimm.2015.09.033. Epub 2015 Sep 30. Hum Immunol. 2015. PMID: 26429317
-
The HLA system and the analysis of multifactorial genetic disease.Trends Genet. 1995 Dec;11(12):493-8. doi: 10.1016/s0168-9525(00)89159-3. Trends Genet. 1995. PMID: 8533166 Review.
-
HLA complex genes in type 1 diabetes and other autoimmune diseases. Which genes are involved?Trends Genet. 2001 Feb;17(2):93-100. doi: 10.1016/s0168-9525(00)02180-6. Trends Genet. 2001. PMID: 11173119 Review.
Cited by
-
Structure and dynamics of molecular networks: a novel paradigm of drug discovery: a comprehensive review.Pharmacol Ther. 2013 Jun;138(3):333-408. doi: 10.1016/j.pharmthera.2013.01.016. Epub 2013 Feb 4. Pharmacol Ther. 2013. PMID: 23384594 Free PMC article. Review.
-
Analysis of AML genes in dysregulated molecular networks.BMC Bioinformatics. 2009 Sep 17;10 Suppl 9(Suppl 9):S2. doi: 10.1186/1471-2105-10-S9-S2. BMC Bioinformatics. 2009. PMID: 19761572 Free PMC article.
-
Analysis of AML Genes in Dysregulated Molecular Networks.Summit Transl Bioinform. 2009 Mar 1;2009:1-18. Summit Transl Bioinform. 2009. PMID: 21347161 Free PMC article.
-
Identification of T1D susceptibility genes within the MHC region by combining protein interaction networks and SNP genotyping data.Diabetes Obes Metab. 2009 Feb;11 Suppl 1(Suppl 1):60-6. doi: 10.1111/j.1463-1326.2008.01004.x. Diabetes Obes Metab. 2009. PMID: 19143816 Free PMC article.
-
The molecular pathogenesis of HIV-1 associated nephropathy: recent advances.J Mol Med (Berl). 2011 May;89(5):429-36. doi: 10.1007/s00109-010-0719-x. Epub 2011 Jan 11. J Mol Med (Berl). 2011. PMID: 21221512 Review.
References
-
- The Gene Ontology http://www.geneontology.org
Publication types
MeSH terms
Substances
Grants and funding
LinkOut - more resources
Full Text Sources
Medical
