Comparative Study
. 2007 Nov 28:8:438.
doi: 10.1186/1471-2164-8-438.

Dynamic gene expression in fish muscle during recovery growth induced by a fasting-refeeding schedule

Affiliations
Comparative Study

Dynamic gene expression in fish muscle during recovery growth induced by a fasting-refeeding schedule

Pierre-Yves Rescan et al. BMC Genomics. .

Abstract

Background: Recovery growth is a phase of rapid growth that is triggered by adequate refeeding of animals following a period of weight loss caused by starvation. In this study, to obtain more information on the system-wide integration of recovery growth in muscle, we undertook a time-course analysis of transcript expression in trout subjected to a food deprivation-refeeding sequence. For this purpose complex targets produced from muscle of trout fasted for one month and from muscle of trout fasted for one month and then refed for 4, 7, 11 and 36 days were hybridized to cDNA microarrays containing 9023 clones.

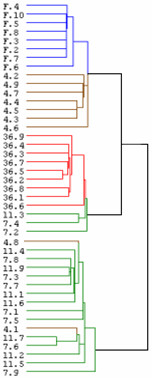
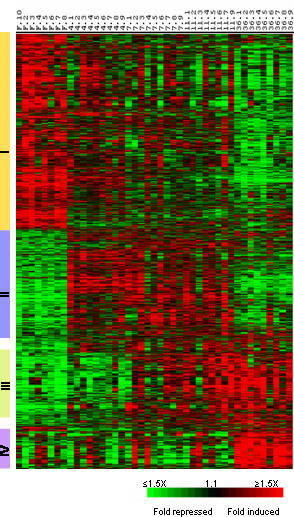
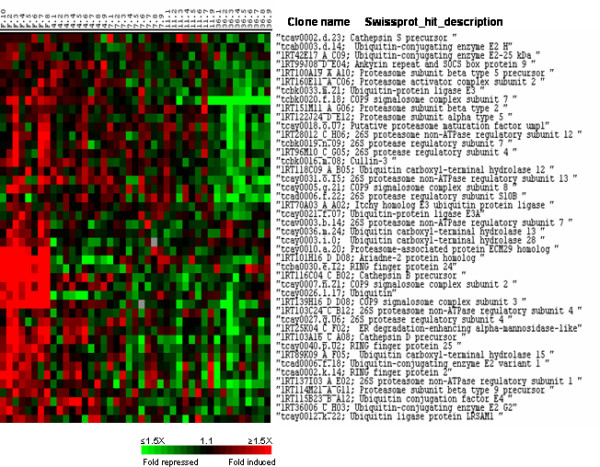
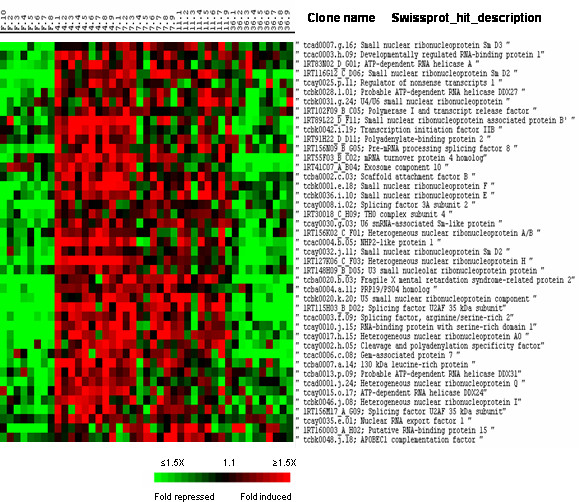
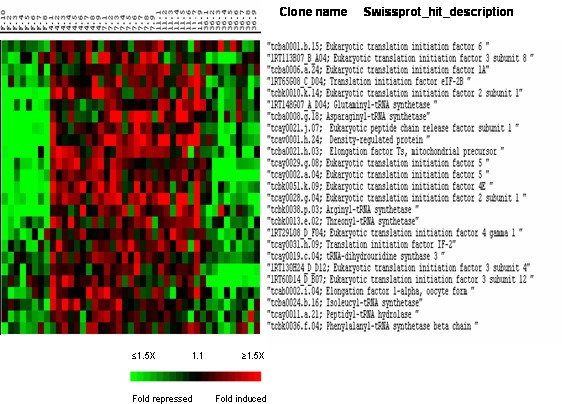
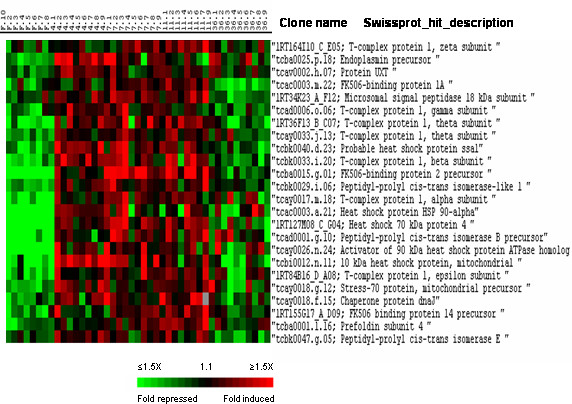
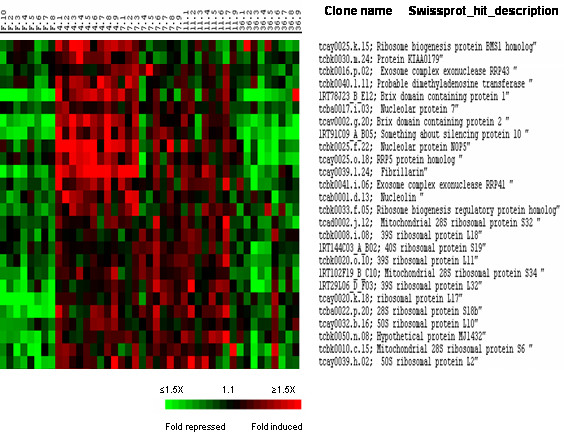
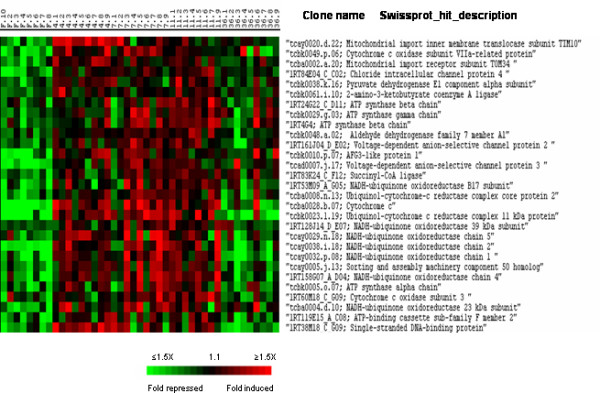
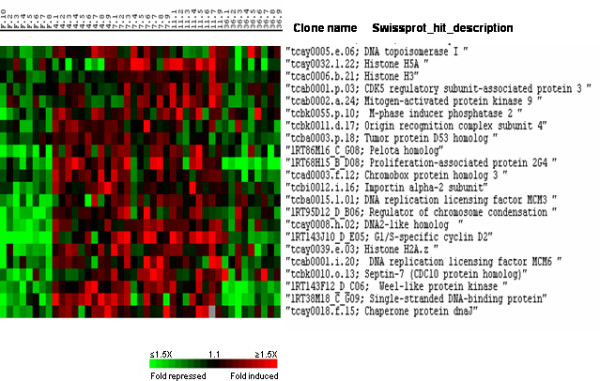
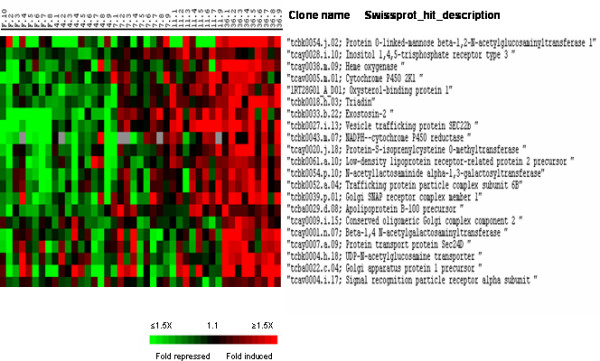
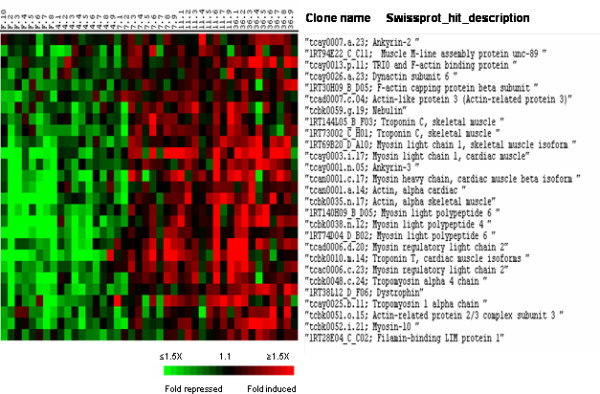
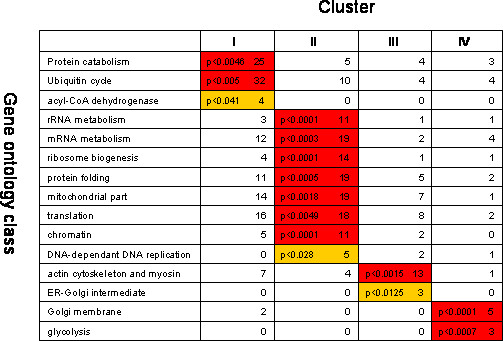
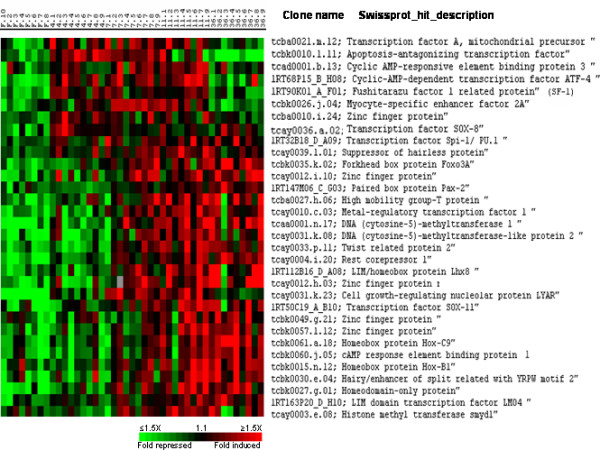
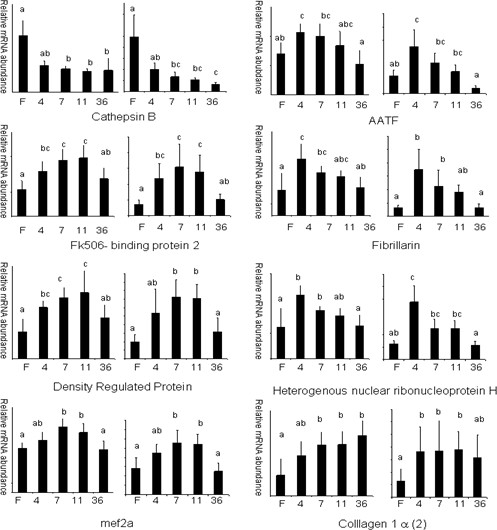
Results: Significance analysis of microarrays (SAM) and temporal expression profiling led to the segregation of differentially expressed genes into four major clusters. One cluster comprising 1020 genes with high expression in muscle from fasted animals included a large set of genes involved in protein catabolism. A second cluster that included approximately 550 genes with transient induction 4 to 11 days post-refeeding was dominated by genes involved in transcription, ribosomal biogenesis, translation, chaperone activity, mitochondrial production of ATP and cell division. A third cluster that contained 480 genes that were up-regulated 7 to 36 days post-refeeding was enriched with genes involved in reticulum and Golgi dynamics and with genes indicative of myofiber and muscle remodelling such as genes encoding sarcomeric proteins and matrix compounds. Finally, a fourth cluster of 200 genes overexpressed only in 36-day refed trout muscle contained genes with function in carbohydrate metabolism and lipid biosynthesis. Remarkably, among the genes induced were several transcriptional regulators which might be important for the gene-specific transcriptional adaptations that underlie muscle recovery.

Conclusion: Our study is the first demonstration of a coordinated expression of functionally related genes during muscle recovery growth. Furthermore, the generation of a useful database of novel genes associated with muscle recovery growth will allow further investigations on particular genes, pathways or cellular process involved in muscle growth and regeneration.


Figures

Figure 1
Figure 1
Unsupervised hierarchical clustering consistently sorts fish muscle samples according to feeding conditions. F2–10: muscle of distinct fasted trout, 41–9, 71–9, 111–8 and 361–9: muscle of 4, 7, 11 and 36 days distinct refed trout.
Figure 2
Figure 2
Supervised clustering analysis of the differentially expressed genes selected by SAM. Cluster I comprises genes up-regulated in muscle from fasted animals, cluster II includes genes with transient induction 4 to 11 days post-refeeding, cluster III contains genes whose expression began at 7 days post refeeding and was maintained up to 36 days post-refeeding and cluster IV contains genes up-regulated 36 days post-refeeding. Each row represents the temporal expression pattern of a single gene and each column corresponds to a single sample: columns 1 to 8: muscle from distinct fasted trout ; columns 9 to 17, 18 to 26, 27 to 34 and 35 to 43 : muscle from 4, 7, 11 and 36 day distinct refed trout, respectively. Expression levels are represented by a color tag, with red representing the highest levels and green the lowest levels of expression.
Figure 3
Figure 3
Supervised clustering of SAM selected genes belonging to cluster I and involved in protein degradation. Columns as in figure 2.
Figure 4
Figure 4
Supervised clustering of SAM selected genes belonging to cluster II and involved in RNA synthesis and processing. Columns as in figure 2.
Figure 5
Figure 5
Supervised clustering of SAM selected genes belonging to cluster II and involved in translation. Columns as in figure 2.
Figure 6
Figure 6
Supervised clustering of SAM selected genes belonging to cluster II and involved in chaperon activity. Columns as in figure 2.
Figure 7
Figure 7
Supervised clustering of SAM selected genes belonging to cluster II and involved in ribosome formation. Genes regulating ribosome biogenesis segregate from genes encoding ribosomal proteins forming a subcluster peaking at 4 days post-refeeding. Columns as in figure 2.
Figure 8
Figure 8
Supervised clustering of SAM selected genes belonging to cluster II and involved in mitochondrion biogenesis and activity. Columns as in figure 2.
Figure 9
Figure 9
Supervised clustering of SAM selected genes belonging to cluster II and involved in cell division and chromatin assembly. Columns as in figure 2.
Figure 10
Figure 10
Supervised clustering of SAM selected genes belonging to cluster III and IV and involved in reticulum and Golgi dynamics. Columns as in figure 2.
Figure 11
Figure 11
Supervised clustering of SAM selected genes belonging to cluster III and involved in cytoskeletal and myofibrillar organisation. Columns as in figure 2.
Figure 12
Figure 12
Ontology-matrix showing functional grouping of genes belonging to clusters I–IV. The enrichment of genes of a given functional class is indicated for each cluster. Also are represented the p-values. Dark and light colors represent P-values of < 0.005 and < 0.05 respectively
Figure 13
Figure 13
Supervised clustering of SAM selected genes induced during muscle recovery growth and involved in transcriptional regulation. Columns as in figure 2.
Figure 14
Figure 14
Relative mRNA expression levels of selected genes in muscle from fasted (F), 4 (4), 7 (7), 11 (11) and 36 (36) day-refed trout as obtained by microarray hybridisation (left) and Q-PCR (right). The mRNA levels measured by Q-PCR were normalized to levels of 18S rRNA. Bars sharing the same letter(s) are not significantly different (p < 0.05).

References

    1. Hornick JL, Van Eenaeme C, Gerard O, Dufrasne I, Istasse L. Mechanisms of reduced and compensatory growth. Domest Anim Endocrinol. 2000;19:121–132. - PubMed
    1. Brodeur JC, Peck LS, Johnston IA. Feeding increases MyoDand PCNA expression in myogenic progenotors cells of Notothenia coriiceps. J Fish Biol. 2002;60:1475–1485.
    1. Fauconneau B, Paboeuf G. Effect of fasting and refeeding on in vitro muscle cell proliferation in rainbow trout (Oncorhynchus mykiss) Cell Tissue Res. 2000;301:459–463. - PubMed
    1. Koumans JT, Akster HA. Myogenic cells in development and growth of fish. Comp Biochem Physiol A. 1995;110:3–20.
    1. Duan C. Nutritional and developmental regulation of insulin-like growth factors in fish. J Nutr. 1998;128:306S–314S. - PubMed

Publication types

MeSH terms