Gene expression profiling of leukemic cells and primary thymocytes predicts a signature for apoptotic sensitivity to glucocorticoids
- PMID: 18045478
- PMCID: PMC2228275
- DOI: 10.1186/1475-2867-7-18
Gene expression profiling of leukemic cells and primary thymocytes predicts a signature for apoptotic sensitivity to glucocorticoids
Abstract
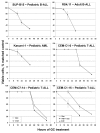
Background: Glucocorticoids (GC's) play an integral role in treatment strategies designed to combat various forms of hematological malignancies. GCs also are powerful inhibitors of the immune system, through regulation of appropriate cytokines and by causing apoptosis of immature thymocytes. By activating the glucocorticoid receptor (GR), GCs evoke apoptosis through transcriptional regulation of a complex, interactive gene network over a period of time preceding activation of the apoptotic enzymes. In this study we used microarray technology to determine whether several disparate types of hematologic cells, all sensitive to GC-evoked apoptosis, would identify a common set of regulated genes. We compared gene expression signatures after treatment with two potent synthetic GCs, dexamethasone (Dex) and cortivazol (CVZ) using a panel of hematologic cells. Pediatric CD4+/CD8+ T-cell leukemia was represented by 3 CEM clones: two sensitive, CEM-C7-14 and CEM-C1-6, and one resistant, CEM-C1-15, to Dex. CEM-C1-15 was also tested when rendered GC-sensitive by several treatments. GC-sensitive pediatric B-cell leukemia was represented by the SUP-B15 line and adult B-cell leukemia by RS4;11 cells. Kasumi-1 cells gave an example of the rare Dex-sensitive acute myeloblastic leukemia (AML). To test the generality of the correlations in malignant cell gene sets, we compared with GC effects on mouse non-transformed thymocytes.
Results: We identified a set of genes regulated by GCs in all GC-sensitive malignant cells. A portion of these were also regulated in the thymocytes. Because we knew that the highly Dex-resistant CEM-C1-15 cells could be killed by CVZ, we tested these cells with the latter steroid and again found that many of the same genes were now regulated as in the inherently GC-sensitive cells. The same result was obtained when we converted the Dex-resistant clone to Dex-sensitive by treatment with forskolin (FSK), to activate the adenyl cyclase/protein kinase A pathway (PKA).
Conclusion: Our results have identified small sets of genes that correlate with GC-sensitivity in cells from several hematologic malignancies. Some of these are also regulated in normal mouse thymocytes.
Figures


Similar articles
-
Resistance of human leukemic CEM-C1 cells is overcome by synergism between glucocorticoid and protein kinase A pathways: correlation with c-Myc suppression.Cancer Res. 1998 Aug 15;58(16):3684-93. Cancer Res. 1998. PMID: 9721879
-
Regulation of a distinctive set of genes in glucocorticoid-evoked apoptosis in CEM human lymphoid cells.Recent Prog Horm Res. 2003;58:175-97. doi: 10.1210/rp.58.1.175. Recent Prog Horm Res. 2003. PMID: 12795419 Review.
-
Identification of genes leading to glucocorticoid-induced leukemic cell death.Lipids. 2004 Aug;39(8):821-5. doi: 10.1007/s11745-004-1302-7. Lipids. 2004. PMID: 15638253 Review.
-
Rapamycin sensitizes glucocorticoid resistant acute lymphoblastic leukemia CEM-C1 cells to dexamethasone induced apoptosis through both mTOR suppression and up-regulation and activation of glucocorticoid receptor.Biomed Environ Sci. 2013 May;26(5):371-81. doi: 10.3967/0895-3988.2013.05.006. Biomed Environ Sci. 2013. PMID: 23611130
-
Resistance to glucocorticoid-induced apoptosis in human T-cell acute lymphoblastic leukemia CEM-C1 cells is due to insufficient glucocorticoid receptor expression.Cancer Res. 1996 Nov 1;56(21):5033-8. Cancer Res. 1996. PMID: 8895760
Cited by
-
Glucocorticoid-mediated co-regulation of RCAN1-1, E4BP4 and BIM in human leukemia cells susceptible to apoptosis.Biochem Biophys Res Commun. 2015 Aug 7;463(4):1291-6. doi: 10.1016/j.bbrc.2015.06.106. Epub 2015 Jun 20. Biochem Biophys Res Commun. 2015. PMID: 26102033 Free PMC article.
-
REDD1/DDIT4-independent mTORC1 inhibition and apoptosis by glucocorticoids in thymocytes.Mol Cancer Res. 2014 Jun;12(6):867-77. doi: 10.1158/1541-7786.MCR-13-0625. Epub 2014 Mar 10. Mol Cancer Res. 2014. PMID: 24615339 Free PMC article.
-
Use of recombinant cell-permeable small peptides to modulate glucocorticoid sensitivity of acute lymphoblastic leukemia cells.Biochemistry. 2010 Oct 19;49(41):8892-901. doi: 10.1021/bi1007723. Biochemistry. 2010. PMID: 20831260 Free PMC article.
-
Bim polymorphisms: influence on function and response to treatment in children with acute lymphoblastic leukemia.Clin Cancer Res. 2013 Sep 15;19(18):5240-9. doi: 10.1158/1078-0432.CCR-13-1215. Epub 2013 Aug 1. Clin Cancer Res. 2013. PMID: 23908358 Free PMC article.
-
Complete miRNA-15/16 loss in mice promotes hematopoietic progenitor expansion and a myeloid-biased hyperproliferative state.Proc Natl Acad Sci U S A. 2023 Oct 24;120(43):e2308658120. doi: 10.1073/pnas.2308658120. Epub 2023 Oct 16. Proc Natl Acad Sci U S A. 2023. PMID: 37844234 Free PMC article.
References
-
- Chauhan D, Auclair D, Robinson EK, Hideshima T, Li G, Podar K, Gupta D, Richardson P, Schlossman RL, Krett N, Chen LB, Munshi NC, Anderson KC. Identification of genes regulated by dexamethasone in multiple myeloma cells using oligonucleotide arrays. Oncogene. 2002;21:1346–1358. doi: 10.1038/sj.onc.1205205. - DOI - PubMed
-
- Schmidt S, Rainer J, Riml S, Ploner C, Jesacher S, Achmüller C, Presul E, Skvortsov S, Crazzolara R, Fiegl M, Raivio T, Jänne OA, Geley S, Meister B, Kofler R. Identification of glucocorticoid-response genes in children with acute lymphoblastic leukemia. Blood. 2006;107:2061–2069. doi: 10.1182/blood-2005-07-2853. - DOI - PubMed
Grants and funding
LinkOut - more resources
Full Text Sources
Research Materials
Miscellaneous

