. 2008 Feb;36(2):477-88.
doi: 10.1093/nar/gkm1050. Epub 2007 Nov 27.

The formation pathway of tetramolecular G-quadruplexes

Affiliations

The formation pathway of tetramolecular G-quadruplexes

Caroline Bardin et al. Nucleic Acids Res. 2008 Feb.

Abstract

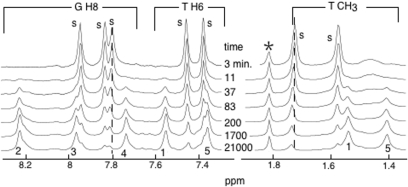
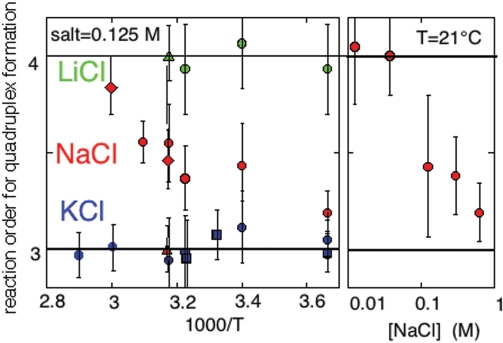
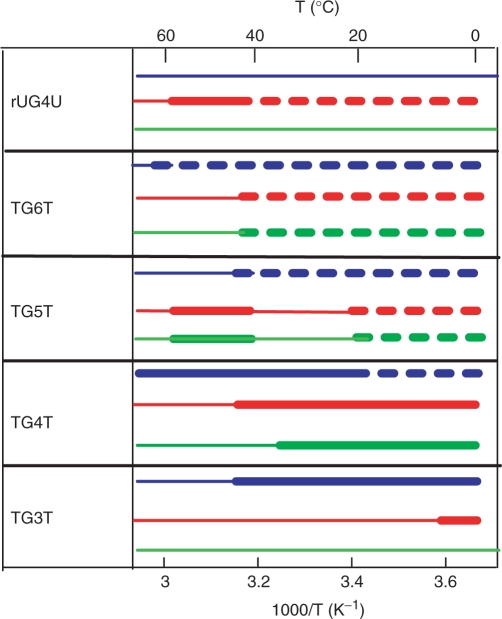
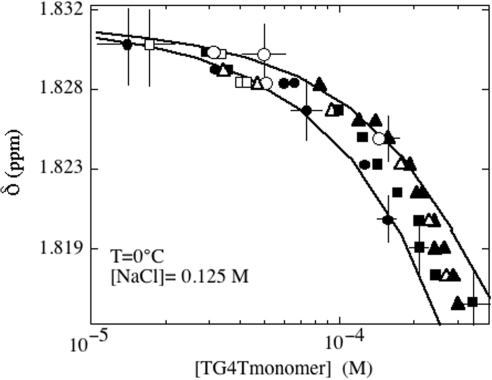
Oligonucleotides containing guanosine stretches associate into tetrameric structures stabilized by monovalent ions. In order to describe the sequence of reactions leading to association of four identical strands, we measured by NMR the formation and dissociation rates of (TGnT)4 quadruplexes (n = 3-6), their dissociation constants and the reaction orders for quadruplex formation. The quadruplex formation rates increase with the salt concentration but weakly depend on the nature (K+, Na+ or Li+) of the counter ions. The activation energies for quadruplex formation are negative. The quadruplex lifetimes strongly increase with the G-tract length and are much more longer in K+ solution than in Na+ or Li+ solutions. The reaction order for quadruplex formation is 3 in 0.125 M KCl and 4 in LiCl solutions. The kinetics measurements suggest that quadruplex formation proceeds step by step via sequential strand association into duplex and triplex intermediate species. Triplex formation is rate limiting in 0.125 M KCl solution. In LiCl, each step of the association process depends on the strand concentration. Parallel reactions to formation of the fully matched canonical quadruplex may result in kinetically trapped mismatched quadruplexes making the canonical quadruplex practically inaccessible in particular at low temperature in KCl solution.


Figures

Figure 1.
Figure 1.
Aromatic and methyl proton region of spectra recorded during the association kinetics of TG3T. The spectra were collected at different times right after melting of the oligonucleotide. The NMR peaks of the monomer are labeled ‘s’ and those of the quadruplex are labeled by the residue number according to Jin et al. (8). The line labeled by a star is that of acetate, a marker used to control the solution pH. The aromatic and methyl proton regions of the NMR spectrum show several well-resolved lines providing markers to measure the fraction of each species as a function of the time. The small chemical shifts observed for several NMR peaks of the monomer are indicated by dotted lines. They reflect a fast exchange situation between the monomer and an intermediate species, presumably (TG3T)2 (see text). Solution conditions: (TG3T) = 1.5 mM, T = 0°C, [K+] = 10 mM.
Figure 2.
Figure 2.
Formation kinetics of (TG3T)4. Left panel: evolution of the bound (open circles) and free (black circles) strand fractions during (TG3T)4 formation in KCl 10 mM at 0°C. The oligonucleotide concentration is 1.5 mM. Note that the timescale is logarithmic. The same half reaction time is measured for the free and bound strand fractions. The monomer proportion at equilibrium, αeq = 0.1, yields the reduced dissociation constant: Fi = 7.2 × 10⁻⁵ M. Right panel: half reaction time for (TG3T)4 formation versus the oligonucleotide concentration at 0°C in 0.125 M (black squares) and 10 mM (black circles) KCl. The lines drawn through the data points show that the half reaction time increases as power of −2 of the oligonucleotide concentration and therefore establishes that the reaction order is 3.
Figure 3.
Figure 3.
Reaction order for G-quadruplex formation. Left panel: reaction orders versus temperature in 0.125 M salt solutions for formation of (TG3T)4 (squares), (TG4T)4 (circles), (rUG4U)4 (triangle) and (TG5T) 4 (diamond). The reaction order is 3 in KCl solution (blue) and 4 in LiCl solution (green) solution. In NaCl solution (red), the reaction order increases with temperature and depends on the G-tract length. Right panel: at 21°C, the reaction order for (TG4T)4 formation decreases as a function of the NaCl concentration.
Figure 4.
Figure 4.
Effect of temperature on the formation and dissociation half lifetime and on the reduced dissociation constant of (TG4T)4 in 0.125 M KCl, NaCl and LiCl. Upper panels: quadruplex lifetimes (triangles). Half formation times of the canonical quadruplex (open squares) and half association times of the TG4T monomer (black circles) measured in 10−4 M oligonucleotide solutions or extrapolated at 10−4 M from measures at higher oligonucleotide concentrations. The half lifetimes for canonical quadruplex formation and for monomer association are identical in the range of temperature where the formation of mismatched quadruplex is negligible (Table 1). Lower panel: reduced equilibrium constants derived from the monomer concentration at equilibrium (open circle). The crosses indicate the reduced equilibrium constants computed from the association and dissociation rates used in the numerical simulations.
Scheme 1.
Scheme 1.
Influence of the temperature on the formation of (rUG4U)4 and (TGnT)4 quadruplexes in 0.125 M Li+ (green), Na+ (red) and K+ (blue). Canonical quadruplex formation prevails in the temperature ranges indicated by heavy full lines. Strand association results predominantly in kinetically trapped mismatched structures in the temperature ranges indicated by heavy dotted lines. The thin colored lines indicate the temperature ranges where no data are available. The formation of mismatched structure increases with the G tract length, at low temperature and in K+ solution.
Figure 5.
Figure 5.
TG5T association kinetics at 42°C in 0.125 M KCl. The oligonucleotide concentration is 0.1 mM. Left panel: The imino proton region of spectra recorded at different times during TG5T association reveals the formation of two quadruplexes. The blue dots show the imino protons of the canonical quadruplex. The G imino protons of a non-identified quadruplex are labeled by red dots. This species, presumably a mismatched quadruplex, is less stable than the canonical species but its formation rate is faster. It is therefore kinetically trapped in the early stage of the association kinetics. Right panel: evolution of the (TG5T) monomer concentration (black), of the mismatched (red) and canonical (blue) quadruplexes. The full lines showing the evolution of each species are computed according to a model involving two parallel reactions [Equation (2)].
Figure 6.
Figure 6.
Chemical shifts of the low field methyl protons of the TG4T monomer versus the TG4T free monomer concentration. The shifts and the monomer concentrations were measured on spectra collected at different times during the formation of (TG4T)4 in oligonucleotide solutions containing 4 × 10⁻⁵ (open squares), 1.3 × 10⁻⁴ (black circles), 2 × 10⁻⁴ (open circles), 5 × 10⁻⁴ (black squares), 7 × 10⁻⁴ (black triangles) and 10−3 M (open triangles). The chemical shift variation versus the monomer concentration suggests fast exchange between the monomer and an intermediate species, presumably (TG4T)2. The monomer TCH3 frequency is estimated to 1.831 p.p.m. The computed solid lines were obtained by assuming dimer TCH3 frequencies of 1.5 and 1.6 p.p.m. and dimer dissociation constants of 6 × 10⁻³ M and 2 × 10⁻³ M−1. Solution conditions: T = 0°C, [Na+] = 0.125 M.
Figure 7.
Figure 7.
Quadruplex lifetimes versus temperature in 0.125 M KCl (blue), NaCl (red) or LiCl (green). Left panel: (TG4T)4 (circles) and (TG3T)4 (squares) lifetimes. Central panel: (TG5T)4 (triangles) and (TG4T)4 (circles) lifetimes. Right panel: (TG4T)4 lifetime.
Figure 8.
Figure 8.
Simulation of the evolution of the monomeric TG4T fraction during (TG4T)4 formation and of the half association time TG4T in 0.125 M NaCl at 0°C. Left panel: the computed monomer fractions (red lines) are compared to the values measured in 10−4 (open circles) and 10−5 M (filled circles) TG4T solutions. The error bars were estimated by using different markers to measure the monomer fractions. Right panel: the half association lifetimes measured versus the oligonucleotide concentration (black squares) are compared to the computed values (red squares). The simulations were performed by numerical integration using the following parameters: formula image
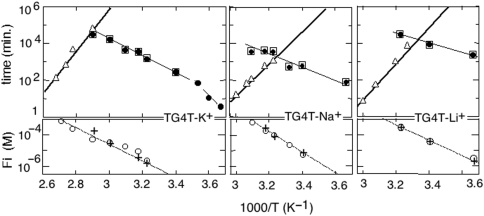
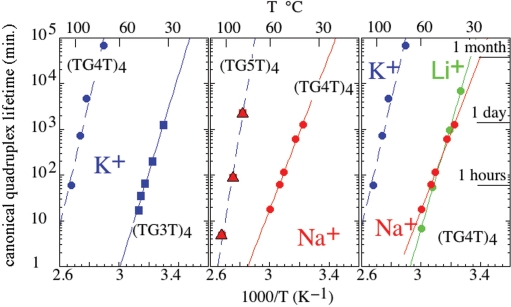
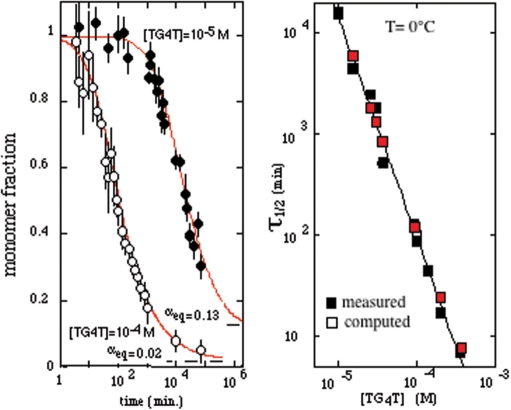
, kof3 = 5.35 × 10⁻⁸ min−1 (corresponding to quadruplex lifetime of 35.6 years estimated by extrapolation at 0°C of the lifetimes displayed in Figure 7. kon3 = 105. The formula image ratio accounting for the observed 3.2 reaction order is 10−5. The computed monomer equilibrium fractions correspond to a reduced dissociation constant, Fi = 6.2 × 10⁻⁷, in agreement with the measured value (Figure 4).

References

    1. Gehring K, Leroy J.-L, Guéron M. A tetrameric DNA structure with protonated cytidine-cytidine base pairs. Nature. 1993;363:561–565. - PubMed
    1. Neidle S, Parkinson GN. The structure of telomeric DNA. Curr. Opin. Struct. Biol. 2003;13:275–283. - PubMed
    1. Burge S, Parkinson GN, Hazel P, Todd AK, Neidle S. Quadruplex DNA: sequence, topology and structure. Nucleic Acids Res. 2006;34:5402–5415. - PMC - PubMed
    1. Davis JT. G-quartets 40 years later: from 5′-GMP to molecular biology and supramolecular chemistry. Angew. Chem. Int. Ed. Engl. 2004;43:668–698. - PubMed
    1. Patel D, Bouaziz S, Kettani A, Wang Y. Structures of guanine-rich and cytosine rich quadruplexes formed by in vitro by telomeric, centromeric and triplets repeats desease DNA sequences. In: Neidel S, editor. Oxford Handbook of Nucleic Acid Structure. USA: Oxford University Press; 1999. pp. 390–452.

Publication types