. 2007 Nov 28;27(48):13108-16.
doi: 10.1523/JNEUROSCI.1892-07.2007.

The TLC: a novel auditory nucleus of the mammalian brain

Affiliations

The TLC: a novel auditory nucleus of the mammalian brain

Enrique Saldaña et al. J Neurosci. .

Abstract

We have identified a novel nucleus of the mammalian brain and termed it the tectal longitudinal column (TLC). Basic histologic stains, tract-tracing techniques and three-dimensional reconstructions reveal that the rat TLC is a narrow, elongated structure spanning the midbrain tectum longitudinally. This paired nucleus is located close to the midline, immediately dorsal to the periaqueductal gray matter. It occupies what has traditionally been considered the most medial region of the deep superior colliculus and the most medial region of the inferior colliculus. The TLC differs from the neighboring nuclei of the superior and inferior colliculi and the periaqueductal gray by its distinct connections and cytoarchitecture. Extracellular electrophysiological recordings show that TLC neurons respond to auditory stimuli with physiologic properties that differ from those of neurons in the inferior or superior colliculi. We have identified the TLC in rodents, lagomorphs, carnivores, nonhuman primates, and humans, which indicates that the nucleus is conserved across mammals. The discovery of the TLC reveals an unexpected level of longitudinal organization in the mammalian tectum and raises questions as to the participation of this mesencephalic region in essential, yet completely unexplored, aspects of multisensory and/or sensorimotor integration.


Figures

Figure 1.
Figure 1.
Size and position of the rat TLC. A, Schematic drawing of a very medial parasagittal section of the rat midbrain tectum 200 μm lateral to the midsagittal plane, showing the relationships between the TLC (blue), the tectal commissures and the PAG. The vertical dotted lines indicate the limits between the caudal, the central and the rostral TLC. The caudal third of the TLC is crossed by the CoIC (outlined in violet). The rostral third of the nucleus is traversed by the enlarged, rostral half of the CoSC (outlined in red). The central third of the TLC lies above the narrow, caudal half of the CoSC. The vertical green arrows indicate the rostrocaudal level of the coronal sections shown in B–I. B–E, Schematic drawings of four idealized coronal sections of the rat midbrain tectum taken at the level of the rostral IC (B), and the caudal (C), central (D) and rostral (E) SC. The number at the bottom of each schematic indicates the distance in millimeters between the depicted plane and the interaural coronal plane (I.A.). The TLC has been represented in blue. Scale bar, 1 mm. F–I, Digital micrographs of four 15-μm-thick paraffin-embedded coronal sections of the rat TLC stained by the Giemsa method. Each section comes from a level that matches the one depicted in the corresponding scheme on the left. The vertical dashed lines indicate the midline. Because of the commissural fascicles that cross the TLC, the neuronal density is lower in the caudal (F and the rostral (I thirds than in the central third (G, H of the nucleus. Scale bar, 100 μm, uncorrected for shrinkage. CNIC, Central nucleus; DCIC, dorsal cortex; ECIC, external cortex; DpG, deep gray; DpW, deep white; InG, intermediate gray; InW, intermediate white; Op, stratum opticum; SuG, superficial gray; Zo, stratum zonale; Aq, cerebral aqueduct; PAGdm, dorsomedial column of the periaqueductal gray matter; pc, posterior commissure; DC, dorsal column.
Figure 2.
Figure 2.
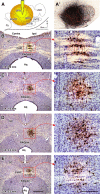
The TLC is labeled following injections of a retrograde tracer into the superior olivary complex. A, A', Schematic drawing (A) and digital micrograph (A') of an injection site of FluoroGold into the right superior olivary complex of the rat. The injection site included most superior olivary complex nuclei and the ventral margin of the overlying reticular formation, and spared the rostrally located pontine nuclei, the medially located pyramidal tract and the caudally located facial motor nucleus. B–E, Pairs of digital micrographs of four coronal sections of the rat brainstem tectum showing TLC neurons retrogradely labeled in the case whose injection site is depicted in A and A'. The number at the bottom of each left micrograph indicates the distance in millimeters between the depicted plane and the interaural coronal plane (I.A.). In each pair the picture on the right shows at higher magnification the area boxed in red. Note that labeled neurons are abundant and widespread within the right TLC, ipsilateral to the injection site, but are virtually absent in the surrounding nuclei, as well as in the left TLC. The midline is indicated by the vertical dashed line. Scale bars: A, A', 0.5 mm; E, left, 1 mm; right, 200 μm. Aq, Cerebral aqueduct; LNTB, lateral nucleus of the trapezoid body; LSO, lateral superior olive; MNTB, medial nucleus of the trapezoid body; MSO, medial superior olive; Py, pyramidal tract; SPN, superior paraolivary nucleus; VNTB, ventral nucleus of the trapezoid body.
Figure 3.
Figure 3.
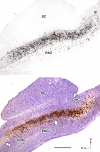
The full length of the rat TLC is revealed in parasagittal sections. Digital photomicrographs of two adjacent parasagittal sections through the medial midbrain tectum from a case in which the retrograde tracer FluoroGold was injected into the ipsilateral superior olivary complex. Labeled neurons are visible throughout the rostrocaudal extent of the TLC. In the section at the top, the tracer was detected immunocytochemically and revealed in black with a nickel-enhanced peroxidase reaction. The section at the bottom was subsequently counterstained by the Nissl method. Scale bar, 0.5 mm. R, Rostral; D, dorsal.
Figure 4.
Figure 4.
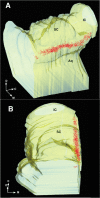
Three-dimensional reconstruction of the rat TLC. Three-dimensional reconstruction of the position of TLC neurons retrogradely labeled after an injection of FluoroGold into the right superior olivary complex. To favor the observation of the labeled neurons, the left side of the mesencephalon has been removed and the right side is depicted as a semitransparent, yellow solid structure. Each red dot represents one TLC labeled neuron. To provide a sharper, cleaner image, the 3D reconstruction was based on every other section; therefore, the actual number of labeled neurons was considerably higher than the number of dots. When all of the sections are used for the 3D reconstruction, the seemingly isolated group of neurons in the rostral end of the TLC is clearly identified as part of the nucleus. A, View from a point located in the left side and slightly elevated. B, View from a point located rostral and dorsal. The vision angle is roughly parallel to the midline and forms a 45° angle with the horizontal plane. Many more neurons were labeled in the central third of the TLC than in the caudal rostral thirds. M, Medial; C, caudal; D, dorsal; Aq, cerebral aqueduct.
Figure 5.
Figure 5.
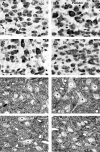
Cytoarchitectural features of the rat TLC. A–D, Digital micrographs of 15 μm-thick, paraffin embedded, horizontal sections of the rat midbrain tectum stained by the Nissl method. They illustrate the typical cytoarchitectural features of the TLC (A), PAGdm (B), medial SC (C), and dorsal column (DC) (D). The arrow in A indicates a typical medium-sized neuron. All four microscopic fields come from a similar rostrocaudal level that corresponds to the central third of the TLC. Scale bar: 25 μm, uncorrected for shrinkage. E–H, High-magnification digital micrographs taken from a single semithin, coronal section through the central third of the TLC. They illustrate the typical cytoarchitectural features of the TLC (E), PAGdm (F, medial SC (G), and dorsal column (H. Toluidine blue stain. Scale bar, 25 μm.
Figure 6.
Figure 6.
Responses of TLC neurons to acoustic stimuli. A, Digital micrograph of a coronal section of the rat midbrain tectum with a visible electrode tract. The dorsal and ventral ends of the tract are indicated by the vertical arrows. As the electrode advanced dorsoventrally, it successively crossed the medial superficial SC, the dorsal column (DC), the TLC, and the PAGdm, whose limits are indicated by brackets. The thick arrow points to an electrolytic lesion made in the DC as the electrode was withdrawn past the auditory responsive TLC. Scale bar, 1 mm. B, Poststimulus time histogram of the response of a single neuron to the auditory search stimulus (wideband noise, 0–12000 Hz at 80 dB SPL) applied to both ears. The end of the stimulus period (75 ms) is indicated by the dashed line. C, Poststimulus time histogram of the response of the same neuron as in B to a tone at best frequency (18.5 kHz at 70 dB SPL) applied to both ears. The end of the stimulus period (75 ms) is indicated by the dashed line. D, Representative tuning curves from single neurons in the TLC. A mix of neurons with broad and narrow tuning was seen.
Figure 7.
Figure 7.
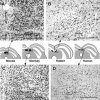
Comparative anatomy of the TLC. A–D, Digital micrographs of coronal sections through the central third of the TLC of the mouse (A), rabbit (B), crab-eating monkey (C), and human (D). Each micrograph is accompanied by a schematic line drawing that shows the position of the TLC. The TLC has been highlighted with dashed lines in the micrographs, and in black in the schemes. Despite interspecies differences in the size and shape of the nucleus, its proximity to the midline and its position dorsal to the PAG are remarkably constant. Scale bars: A, 200 μm; B–D, 0.5 mm.

Similar articles

Cited by

References

    1. Aitkin L. Clifton, NJ: Humana; 1986. The auditory midbrain: structure and function in the central auditory pathway.
    1. Behan M, Kime NM. Spatial distribution of tectotectal connections in the cat. Prog Brain Res. 1996;112:131–142. - PubMed
    1. Behbehani MM. Functional characteristics of the midbrain periaqueductal gray. Prog Neurobiol. 1995;46:575–605. - PubMed
    1. Beitz AJ, Shepard RD. The midbrain periaqueductal gray in the rat. II. A Golgi analysis. J Comp Neurol. 1985;237:460–475. - PubMed
    1. Berman AL. Madison, WI: University of Wisconsin; 1968. The brain stem of the cat: a cytoarchitectonic atlas with stereotaxic coordinates.

Publication types

Substances

LinkOut - more resources