. 2007 Nov 28;27(48):13210-21.
doi: 10.1523/JNEUROSCI.3056-07.2007.

NMDA receptor activation dephosphorylates AMPA receptor glutamate receptor 1 subunits at threonine 840

Affiliations

NMDA receptor activation dephosphorylates AMPA receptor glutamate receptor 1 subunits at threonine 840

Jary Y Delgado et al. J Neurosci. .

Abstract

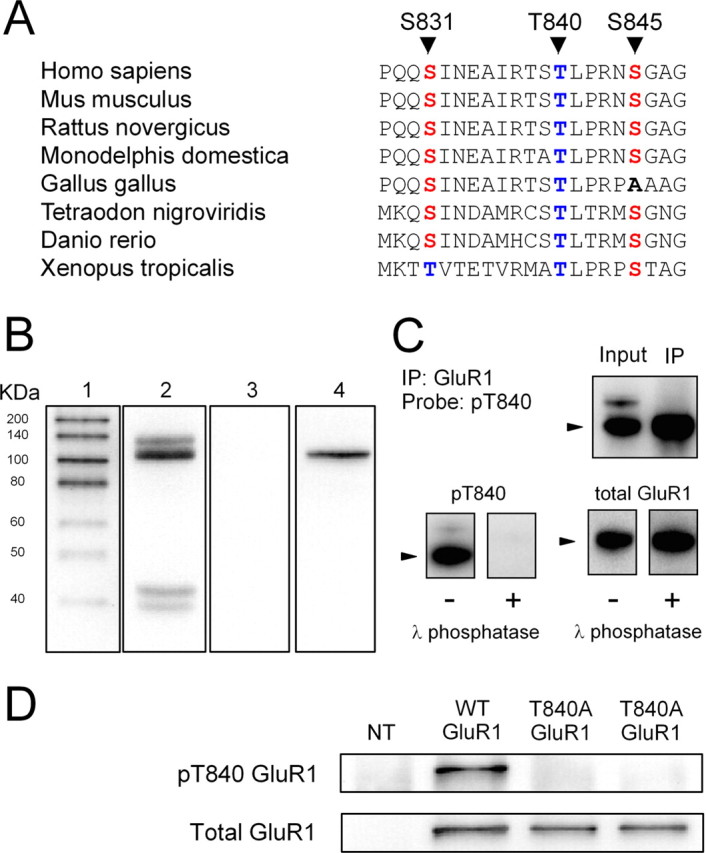
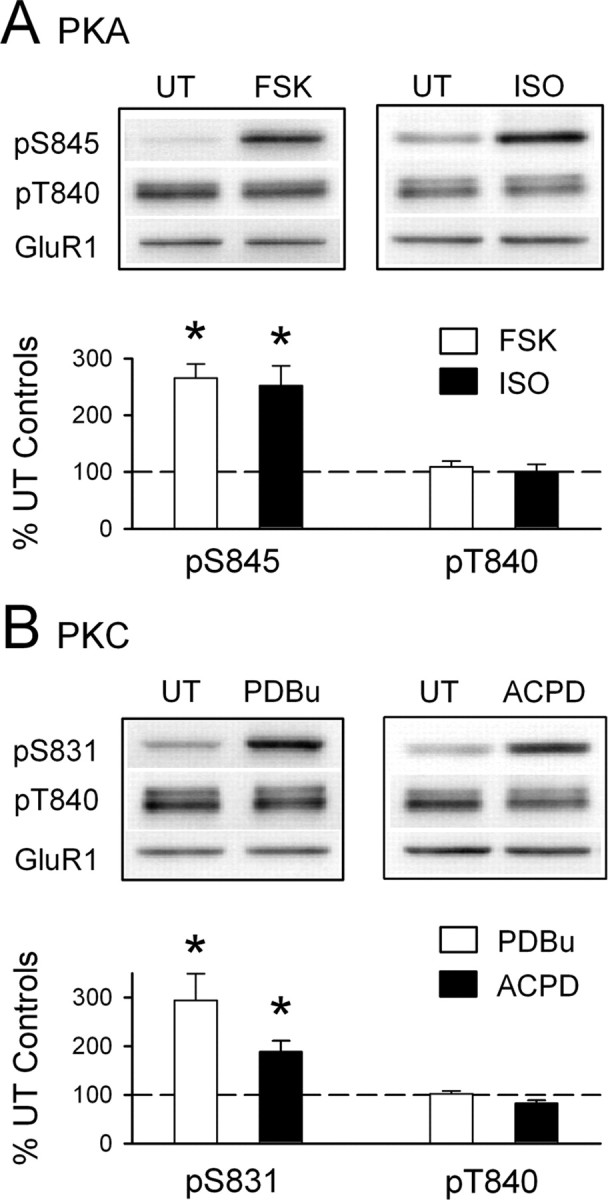
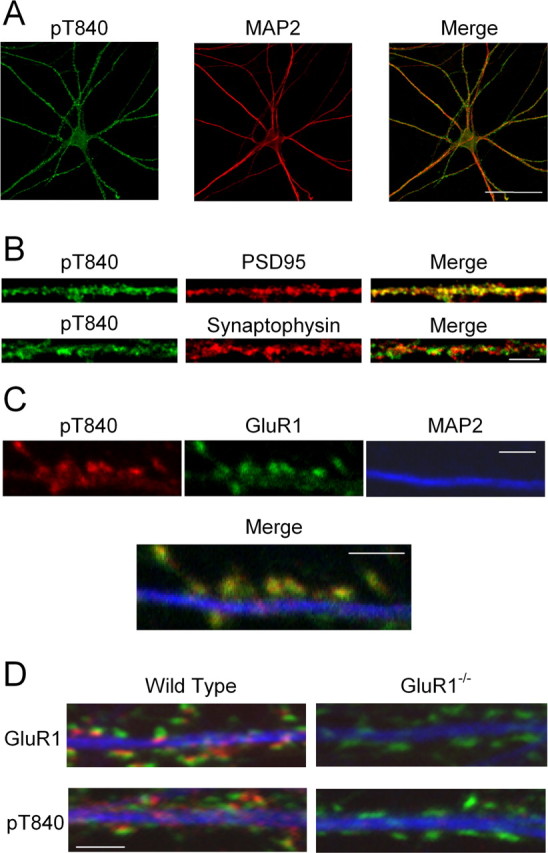
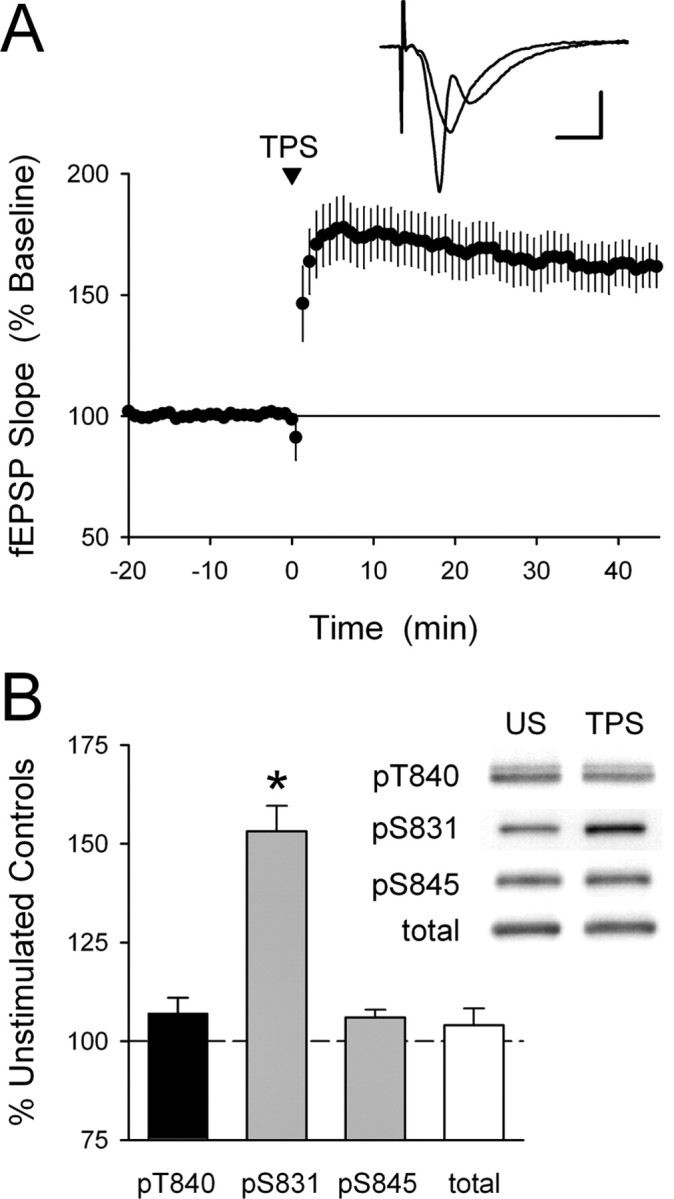
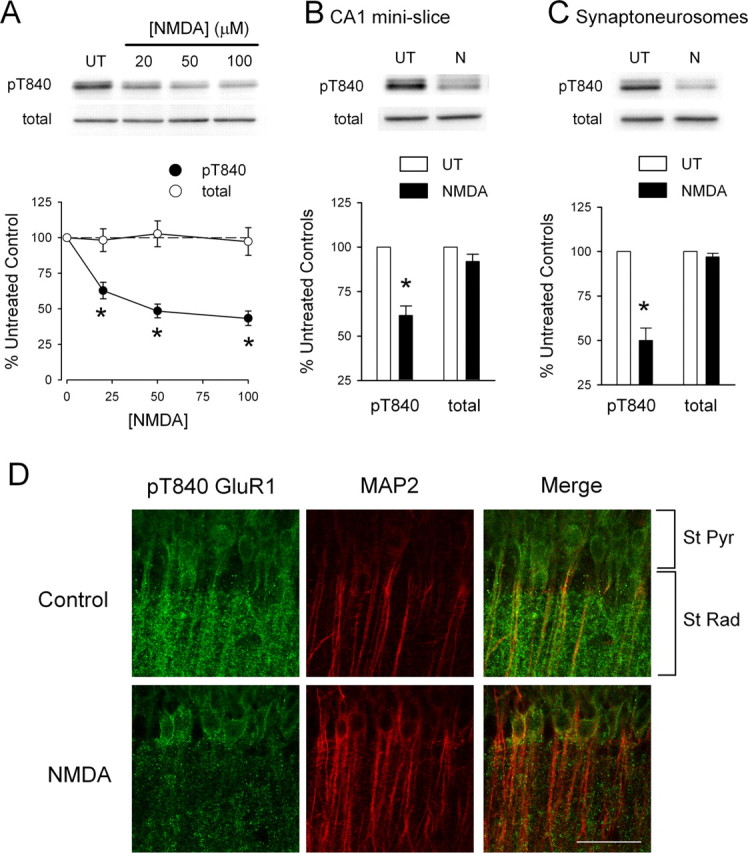
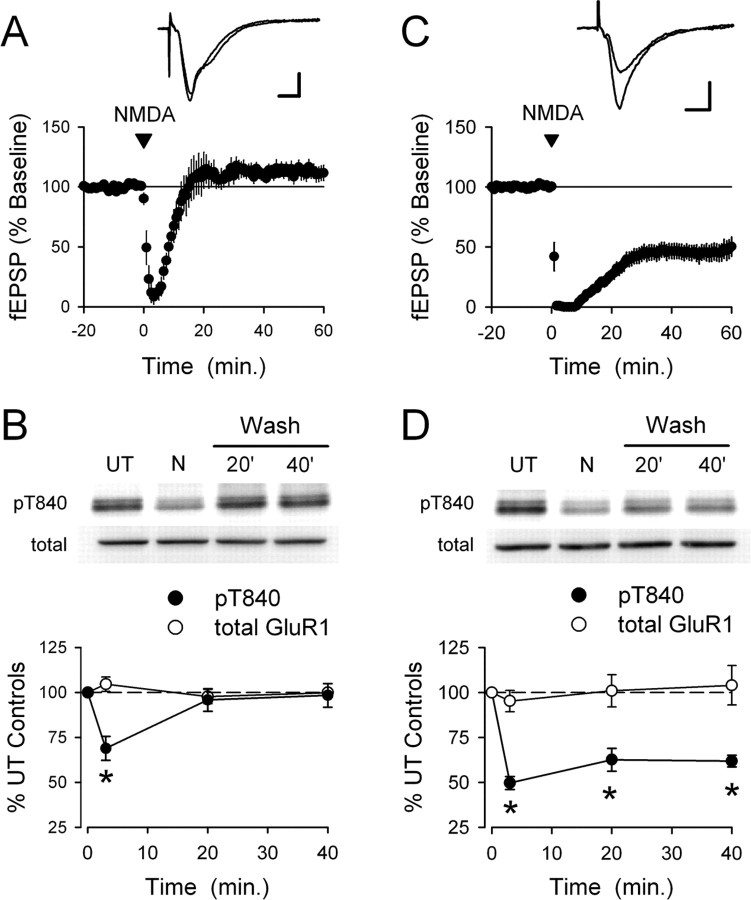
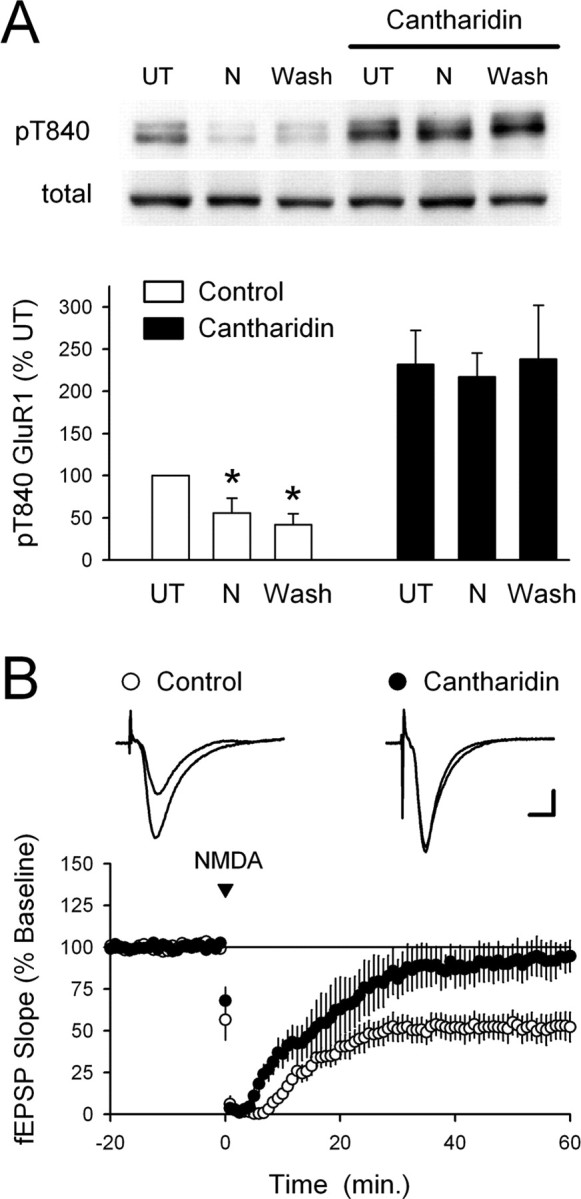
Phosphorylation-dependent changes in AMPA receptor function have a crucial role in activity-dependent forms of synaptic plasticity such as long-term potentiation (LTP) and long-term depression (LTD). Although three previously identified phosphorylation sites in AMPA receptor glutamate receptor 1 (GluR1) subunits (S818, S831, and S845) appear to have important roles in LTP and LTD, little is known about the role of other putative phosphorylation sites in GluR1. Here, we describe the characterization of a recently identified phosphorylation site in GluR1 at threonine 840. The results of in vivo and in vitro phosphorylation assays suggest that T840 is not a substrate for protein kinases known to phosphorylate GluR1 at previously identified phosphorylation sites, such as protein kinase A, protein kinase C, and calcium/calmodulin-dependent kinase II. Instead, in vitro phosphorylation assays suggest that T840 is a substrate for p70S6 kinase. Although LTP-inducing patterns of synaptic stimulation had no effect on GluR1 phosphorylation at T840 in the hippocampal CA1 region, bath application of NMDA induced a strong, protein phosphatase 1- and/or 2A-mediated decrease in T840 phosphorylation. Moreover, GluR1 phosphorylation at T840 was transiently decreased by a chemical LTD induction protocol that induced a short-term depression of synaptic strength and persistently decreased by a chemical LTD induction protocol that induced a lasting depression of synaptic transmission. Together, our results show that GluR1 phosphorylation at T840 is regulated by NMDA receptor activation and suggest that decreases in GluR1 phosphorylation at T840 may have a role in LTD.


Figures

Figure 1.
Figure 1.
Characterization of phospho-T840 antibody. A, Sequence alignment for amino acids surrounding S831, T840, and S845 in GluR1 across several different vertebrate species. B, Proteins in homogenates prepared from mouse hippocampi were resolved by SDS-PAGE, transferred to PVDF membranes, and probed with the anti-phospho-T840 GluR1 antibody (lanes 2 and 3). Four distinct immunoreactive bands were detected in blots probed with the anti-phospho-T840 GluR1 antibody (antibody concentration, 0.12 μg/ml; lane 2), whereas no signal was detected in blots in which the peptide antigen used to generated the phospho-T840 GluR1 antibody was present during the primary antibody incubation (peptide concentration, 0.3 μg/ml; lane 3). Lane 1 shows biotinylated molecular weight markers, whereas lane 4 shows the same blot as lane 3 after reprobing with anti-total GluR1 antibody. C, Top, Immunoblots show bands detected by phospho-T840 GluR1 antibody before and after immunoprecipitating GluR1 from hippocampal extracts. Bottom, Immunoblots showing the effects of treating blots with λ phosphatase (2000 U for 40 min at 32°C) before incubation in anti-phospho-T840 GluR1 antibody (left set of blots). These blots were subsequently stripped and reprobed with a total GluR1 antibody (right set of blots). The arrowheads indicate the ≈110 kDa band corresponding to GluR1. D, Western blot analysis of antibody specificity for T840 phosphorylated GluR1. GluR1 was immunoprecipitated from lysates prepared from HEK cells expressing wild-type (WT) GluR1 or a mutant form GluR1 in which T840 was changed to an alanine (T840A GluR1). Blots were probed with anti-phospho-T840 GluR1 (top), and then stripped and reprobed with total GluR1 antibodies (bottom). The first lane shows nontransfected (NT) controls.
Figure 2.
Figure 2.
The anti-phospho-T840 GluR1 antibody does not recognize S831 and S845 phosphorylated GluR1. A, Hippocampal slices obtained from the same animal were untreated (UT) or exposed to the PKA activators FSK (10–20 μm for 10 min; n = 5) or the β-adrenergic receptor agonist ISO (1 μm for 5 min; n = 4). Both FSK and ISO induced a significant increase in GluR1 phosphorylation at S845 (*p < 0.05 compared with untreated control slices) but had no effect on GluR1 phosphorylation at T840. B, Bath application of the PKC activator PDBu (10 μm for 15 min) significantly increased GluR1 phosphorylation at S831 (*p < 0.05 compared with untreated control slices; n = 4) but had no effect on GluR1 phosphorylation at T840. A 10 min bath application of the mGluR agonist ACPD (1-aminocyclopentane-1,3-dicarboxylic acid) (100 μm) also induced a significant increase in phospho-S831 GluR1 levels (*p < 0.05 compared with untreated controls; n = 5) but had no effect on GluR1 phosphorylation at T840. The immunoblots above each histogram in A and B show representative blots probed with the indicated phospho-specific antibodies. None of the protein kinase activators had effects on total GluR1 levels. Error bars indicate SEM.
Figure 3.
Figure 3.
Immunofluorescent staining of cultured mouse hippocampal neurons with the phospho-T840 GluR1 antibody. A, Confocal images showing that phospho-T840 GluR1-like immunofluorescence is present throughout the soma and MAP2-positive dendrites of hippocampal neurons. Scale bar, 50 μm. B, Higher magnification images of processes in cultured neurons reveal extensive colocalization of phospho-T840 GluR1-like immunofluorescence with the postsynaptic marker PSD-95 (top) but little overlap with the presynaptic marker synaptophysin (bottom). Scale bar, 5 μm. C, Triple staining of cultured hippocampal neurons with anti-phospho-T840 (green), anti-GluR1 (red), and anti-MAP2 (blue) antibodies reveals strong colocalization of phospho-T840 GluR1-like immunofluorescence with total GluR1 staining. Scale bar, 2 μm. D, Cultures of hippocampal neurons obtained from wild-type and GluR1-null mutant mice were stained with anti-MAP2 (blue) and anti-synaptophysin (green) antibodies. Immunostaining for both GluR1 (red; top two panels) and phospho-T840 GluR1 (red; bottom two panels) was strongly diminished in GluR1−/− neurons. Scale bar, 2 μm.
Figure 4.
Figure 4.
GluR1 phosphorylation at T840 is not enhanced by LTP-inducing patterns of synaptic stimulation. A, A TPS protocol consisting of 150 pulses of presynaptic fiber stimulation delivered at 5 Hz induces significant LTP in hippocampal CA1 mini-slices. Field EPSPs were potentiated to 161 ± 8% of baseline 60 min post-TPS (p < 0.001 compared with baseline; n = 5). The inset shows fEPSPs recorded during baseline and 45 min post-TPS. Calibration: 2 mV, 5 ms. B, LTP inducing patterns of synaptic stimulation have no effect on GluR1 phosphorylation at T840. CA1 mini-slices obtained from the same animal were either unstimulated (US) or snap frozen 5 min after activating presynaptic fibers in stratum radiatum with a TPS protocol (150 pulses at 5 Hz). Whereas TPS induced a significant increase in GluR1 phosphorylation at S831 (*p < 0.01 compared with US controls), it had no effect on GluR1 phosphorylation at T840 or S845 (n = 8 experiments). The immunoblots show phospho-GluR1 and total-GluR1 levels in samples from one experiment. Error bars indicate SEM.
Figure 5.
Figure 5.
NMDAR activation dephosphorylates GluR1 at T840. A, Hippocampal slices obtained from the same animal were either left untreated (UT) or exposed to 3 min bath applications of the indicated concentrations of NMDA. NMDA induced a significant, dose-dependent decrease in GluR1 phosphorylation at T840 (filled symbols; *p < 0.05 compared with untreated controls; n = 6). NMDAR activation had no effect on total GluR1 levels (open symbols). The immunoblots show changes in GluR1 phosphorylation at T840 as well as total GluR1 levels in samples obtained from one experiment. B, Bath application of NMDA (20 μm for 3 min) induces significant dephosphorylation of GluR1 at T840 in isolated CA1 mini-slices (*p < 0.05 compared with untreated controls; n = 4). C, Dephosphorylation of GluR1 at T840 is readily detected in synaptoneurosomes prepared from NMDA-treated slices (20 μm NMDA for 3 min; *p < 0.01 compared with synaptoneurosomes from untreated control slices; n = 4). Error bars indicate SEM. D, Phospho-T840 GluR1-like immunofluorescence in stratum radiatum of the hippocampal CA1 region is reduced in NMDA-treated slices. Hippocampal slices were fixed immediately after a 3 min application of 20 μm NMDA and stained with phospho-T840 GluR1 and MAP2 antibodies. Confocal images of the hippocampal CA1 region in an untreated control slice (top) and in a slice exposed to NMDA (bottom). Scale bar, 50 μm.
Figure 6.
Figure 6.
NMDA-induced changes in GluR1 T840 phosphorylation parallel NMDA-induced changes in synaptic strength. A, A 3 min bath application of 20 μm NMDA has no lasting effect on synaptic transmission. NMDA was applied starting at time = 0 (indicated by the arrow). Although synaptic transmission was strongly depressed in the presence of NMDA, synaptic strength returned to baseline levels after NMDA washout (60 min post-NMDA fEPSPs were 112 ± 6% of baseline; n = 6; p = 0.14 compared with baseline). B, NMDAR activation transiently dephosphorylates GluR1 at T840. Hippocampal slices obtained from the same animal were either left untreated or stimulated with NMDA (20 μm for 3 min) and collected for analysis either immediately after NMDA treatment or after NMDA had been washed from the slice chamber for the indicated times. Although levels of T840 phosphorylation GluR1 (filled symbols) were significantly decreased at the end of a 3 min application of 20 μm NMDA, GluR1 phosphorylation at T840 recovered to basal levels by 20 min after NMDA washout. Total GluR1 levels (open symbols) were unchanged. Results are from seven separate experiments; *p < 0.05 compared with untreated control slices (time = 0 on the plot). The inset shows phospho-T840 GluR1 and total GluR1 levels from one experiment. C, Bath application of NMDA (20 μm for 3 min) induces significant LTD in slices bathed in high-Ca2+ ACSF. Sixty minutes after NMDA washout, fEPSPs were depressed to 48 ± 8% of baseline; p < 0.001 compared with baseline; n = 11). The inset shows fEPSPs recorded during baseline and 60 min after NMDA application in a representative experiment. Calibration bars: 1 mV, 5 ms. D, NMDAR activation induces a persistent dephosphorylation of GluR1 at T840 (filled symbols) in slices bathed in high-Ca2+ ACSF (n = 6; *p < 0.05 compared with untreated controls). Total GluR1 levels (open symbols) were unchanged. Error bars indicate SEM. The immunoblots show levels of T840 phosphorylated GluR1 and total GluR1 in a representative experiment.
Figure 7.
Figure 7.
Blocking PP1 and PP2A inhibits NMDA-induced dephosphorylation of GluR1 at T840. A, Slices from the same animal were maintained in high Ca2+-ACSF either alone or in the presence of the PP1 and PP2A inhibitor cantharidin (10 μm). Under control conditions, GluR1 phosphorylation at T840 was significantly decreased both immediately after NMDA application (20 μm for 3 min; N) and 40 min after NMDA washout (Wash; *p < 0.05 compared with untreated controls; n = 5). Basal levels of T840 phosphorylated GluR1 were significantly increased in cantharidin-treated slices (p < 0.01 compared with UT slices bathed in high-Ca2+ ACSF alone), and both the initial and persistent NMDA-induced dephosphorylation of T840 were completely blocked. The immunoblots show phospho-T840 GluR1 and total GluR1 levels from a representative experiment. Error bars indicate SEM. B, Chem-LTD is inhibited in cantharidin-treated slices. Sixty minutes after NMDA application (20 μm for 3 min), fEPSPs were depressed to 52 ± 8% of baseline in vehicle control experiments (open symbols; 0.1% DMSO; n = 6) and were 93 ± 10% of baseline in cantharidin-treated slices (filled symbols; n = 5; p = 0.01 compared with control). Slices were continuously bathed in ACSF containing 10 μm cantharidin for at least 1 h before an experiment.

References

    1. Banke TG, Bowie D, Lee H, Huganir RL, Schousboe A, Traynelis SF. Control of GluR1 AMPA receptor function by cAMP-dependent protein kinase. J Neurosci. 2000;20:89–102. - PMC - PubMed
    1. Barria A, Muller D, Derkach V, Griffith LC, Soderling T. Regulatory phosphorylation of AMPA-type glutamate receptors by CaMKII during long-term potentiation. Science. 1997a;276:2042–2045. - PubMed
    1. Barria A, Derkach V, Soderling T. Identification of the Ca2+/calmodulin-dependent protein kinase II regulatory phosphorylation site in the α-amino-3-hydroxyl-5-methyl-4-isoxazole-propionate type glutamate receptor. J Biol Chem. 1997b;272:32727–32730. - PubMed
    1. Benke TA, Luthi A, Isaac JT, Collingridge GL. Modulation of AMPA receptor unitary conductance by synaptic activity. Nature. 1998;393:793–797. - PubMed
    1. Berg D, Holzmann C, Riess O. 14-3-3 proteins in the nervous system. Nat Rev Neurosci. 2003;4:752–762. - PubMed

Publication types

MeSH terms