. 2007 Nov 28;27(48):13292-302.
doi: 10.1523/JNEUROSCI.3502-07.2007.

Visceral afferents directly activate catecholamine neurons in the solitary tract nucleus

Affiliations

Visceral afferents directly activate catecholamine neurons in the solitary tract nucleus

Suzanne M Appleyard et al. J Neurosci. .

Abstract

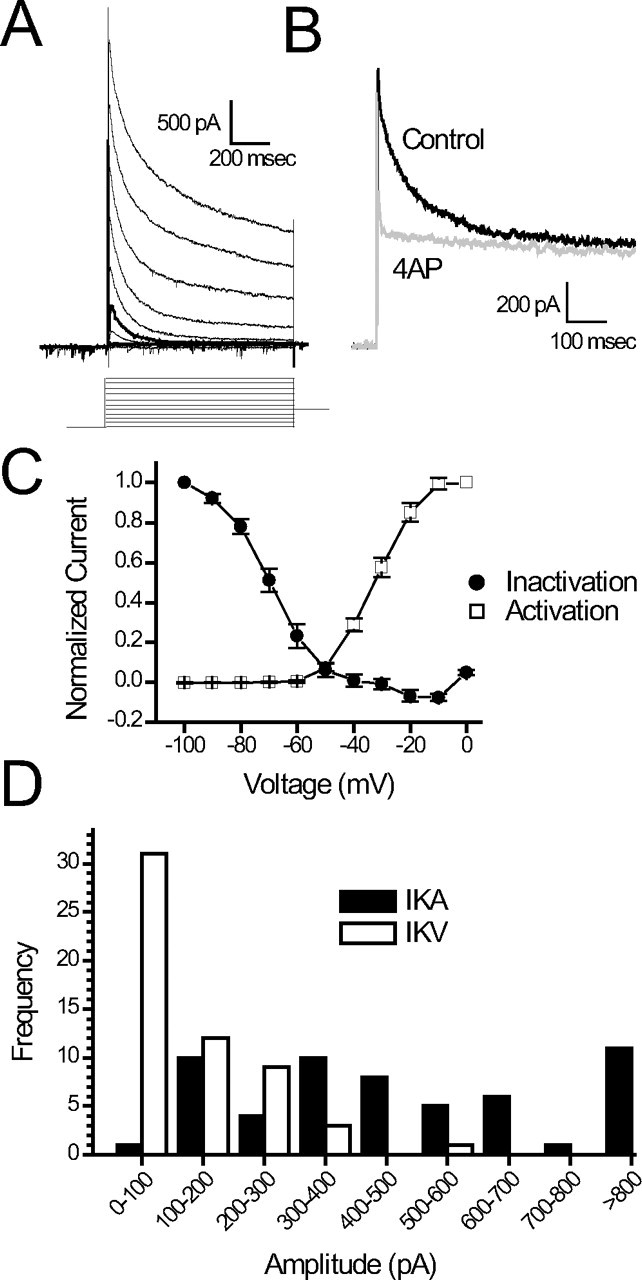
Brainstem A2/C2 neurons are catecholamine (CA) neurons within the solitary tract nucleus (NTS) that influence many homeostatic functions, including cardiovascular reflexes, food intake, and stress. Because NTS is a major interface between sensory visceral afferents and the CNS, NTS CA neurons are ideally suited to coordinate complex responses by their projections to multiple brain regions. To test how NTS CA neurons process visceral afferent information carried by solitary tract (ST) afferents, we identified CA neurons using transgenic mice expressing TH-EGFP (enhanced green fluorescent protein under the control of the tyrosine hydroxylase promoter) and recorded synaptic responses to ST activation in horizontal slices. ST shocks evoked large-amplitude, short-latency, glutamatergic EPSCs (ST-EPSCs) in 90% of NTS CA neurons. Within neurons, ST-EPSCs had constant latency, rarely failed, and depressed substantially at high ST frequencies, indicating that NTS CA neurons receive direct monosynaptic connections from afferent terminals. NTS CA neurons received direct ST inputs from only one or two afferent fibers, with one-half also receiving smaller amplitude indirect inputs. Up to 90% of ST shocks evoked action potentials in NTS CA neurons. However, transmission of sensory afferent information through NTS CA neurons critically depended on the expression of an A-type potassium current (I(KA)), which when active attenuated ST-activated action potentials to a 37% success rate. The satiety peptide, cholecystokinin, presynaptically facilitated glutamate transmission in one-half of NTS CA neurons. Thus, NTS CA neurons are directly driven by visceral afferents with output being modulated by presynaptic peptide receptors and postsynaptic potassium channels.


Figures

Figure 1.
Figure 1.
A–C, Coexpression of TH immunofluorescence with the fluorescence of the EGFP reporter in NTS CA neurons in a coronal section of the transgenic mouse brainstem. A, TH. B, EGFP. C, Merged. EGFP-positive neurons appear green, TH expression red, and colocalization yellow. D, E, Visual identification of neurons within the NTS brain slice preparation relied on coincidence of both the infrared DIC image of the cell membrane (D) with the EPFP fluorescence (E). Sectioning mouse brainstem slices in the horizontal plane allowed placement of the concentric bipolar stimulating electrode on the ST several millimeters from the recording region in medial NTS (light gray). F, G, Individual NTS CA neurons were identified by DIC (F) and fluorescence (G). Two NTS CA-positive neurons are present. CC, Central canal. Scale bars: A–C, 50 μm; D, E, 200 μm; F, G, 15 μm.
Figure 2.
Figure 2.
ST evoked NTS synaptic responses in NTS CA neurons. A, ST activation evoked a low-jitter (i.e., monosynaptic) EPSC in NTS CA neurons. Ten successive EPSCs are overlaid. VM = −60 mV. ST shocks evoked a short-latency EPSC with high reliability (latency, 2.3 ms; jitter, 96 μs; and no observed failures at 50 Hz ST stimulation). B, In some NTS CA neurons, ST activation evoked only high-jitter (i.e., polysynaptic) EPSCs. Ten successive EPSCs are overlaid. VM = −60 mV. ST shocks evoked responses with high variability in latency and amplitude. Two clusters of events (onsets circled, labeled 1 and 2) occurred at different times (event 1: latency, 4.6 ms; jitter, 892 μs). Note that flat lines within circle 1 represent failures of that event. In the case of failure of event 1, event 2 was unaffected and vice versa. The event labeled 3 is a spontaneous synaptic event that never reoccurred and thus is not ST shock related. C, Relationship between latency and jitter (SD of latency) for all NTS CA neurons. Note that nearly all (90%) NTS CA neurons had second-order, monosynaptic ST response characteristics (<200 μs; broken line). Latency was not strictly related to path order. D, NBQX (10 μm) completely blocked the ST-EPSCs in this representative neuron (n = 8). The circles in A and B represent the time windows used for analysis of the onset of each ST-EPSC response. E, Histogram showing the distributions of ST-EPSC amplitudes in NTS CA neurons.
Figure 3.
Figure 3.
Stimulus intensity–response profiles for ST-evoked synaptic transmission. Graded increments in shock intensity delivered to ST produced profiles for the recruitment of each synaptic event. The majority of NTS CA neurons receive monosynaptic inputs (jitter, <200 μs) from one or two ST afferents. A, Stimulus intensity–response relationship for an NTS CA neuron receiving one monosynaptic ST input (latency, 3.1 ms; jitter, 90 μs). Low-intensity stimuli elicited no synaptic response and increasing shock intensity fourfold above threshold had no effect on EPSC amplitude, evidence that ST shocks activated a single axon of constant electrical threshold to trigger the EPSC. Inset are traces of EPSCs elicited by suprathreshold stimulation. The oval indicates the time window for latency analysis. B, Stimulus intensity–response relationship for an NTS CA neuron directly receiving two monosynaptic ST inputs. The inset displays representative traces of EPSCs from this neuron showing the two individual peaks (input 1: latency, 2.0 ms; jitter, 121 μs; input 2: latency, 2.6 ms; jitter, 122 μs). Traces were evoked by increases in stimulus shock intensity and displayed as overlapping traces. The EPSC evoked as input 1 was triggered at lower threshold shock intensity than input 2. As shock intensity was increased, input 2 was recruited as a summed event. Note that input 2 amplitude is plotted as that summed event. If a subtraction is performed, input 1 and input 2 appear to have nearly equal amplitudes but are distinguished by latency and threshold shock intensity. Note that neither input failed to occur when stimulus intensity exceeded threshold for both input 1 and input 2. The ovals (1 and 2) indicate the time windows for latency analysis of the two events. This pattern of stimulus intensity–response profile indicating two direct, monosynaptic connections was found in one-half of all second-order NTS CA neurons (i.e., these neurons had dual, direct ST contacts). Error bars indicate SEM.
Figure 4.
Figure 4.
Stimulus intensity–response profile for ST-evoked mixed monosynaptic and polysynaptic inputs. Input 1 was monosynaptic (latency, 2.2; jitter, 118 μs), and input 2 was polysynaptic (latency, 3.4; jitter, 387 μs). The top part displays traces of EPSCs elicited by stimulus shocks that were suprathreshold for both inputs. The ovals mark the two time windows for analysis of the onset of the responses. Event amplitudes did not change with ST shock intensities severalfold above threshold (bottom plot). Note that failures of the polysynaptic input pathway produced lower amplitude EPSCs to input 1 despite stimulus shock intensities severalfold above threshold for either input. Error bars indicate SEM.
Figure 5.
Figure 5.
FDD of monosynaptic and polysynaptic ST inputs to NTS CA neurons. Bursts of five ST shocks evoked a series of EPSCs in these neurons. A, A representative NTS CA neuron with a single monosynaptic EPSC (latency, 3.0; jitter, 117 μs) shows that, in 10 consecutive traces, bursts of five ST-shocks (50 Hz) evoked progressively smaller EPSCs as the burst progressed. Note that the synaptic responses fully recovered over the 3 s interval between bursts of shocks. Similar, substantial FDD was found in all monosynaptic ST-EPSCs in NTS CA neurons. B, A representative NTS CA neuron with polysynaptic EPSCs (latency, 4.0; jitter, 336 μs) shows that, in 10 consecutive traces, bursts of five ST-shocks (50 Hz) evoked constant-amplitude EPSCs throughout the burst. C, Summary averages for amplitudes of EPSC1, 2, 3, 4, and 5 from neurons receiving either direct (i.e., second order) (n = 64) or only indirect ST inputs (i.e., higher order) (n = 7). Neurons receiving only indirect inputs have significantly smaller EPSC amplitudes (EPSC1–4) than neurons receiving direct inputs (p < 0.01). FDD significantly depressed the mean amplitude of ST-EPSCs during the train of five in neurons receiving only direct inputs (p < 0.01). FDD was significantly greater in neurons receiving direct inputs than neurons receiving only indirect inputs (p < 0.01). Error bars indicate SEM.
Figure 6.
Figure 6.
Most NTS CA neurons express substantial, early transient outward current (IKA). A, In a representative NTS CA neuron expressing a large IKA, depolarizing steps evoked currents with a large, early component that rapidly decayed to steadier levels within 200 ms. Under voltage clamp, neurons were preconditioned at −100 mV before stepping to test levels starting at −100 mV and increasing by +10 mV with each sweep. B, 4AP blocked the early, transient current, consistent with IKA. Currents were evoked by a test step to 0 mV after a conditioning step to −100 mV without (control) and with 5 mm 4AP. C, Plots of mean activation and inactivation curves for IKA (peak current minus persistent current) indicate a critical voltage dependence near resting potentials for these neurons (n = 61). Error bars indicate SEM. D, Histogram showing the distributions of the IKA and IKV current amplitudes for second order neurons at −30 mV.
Figure 7.
Figure 7.
IKA greatly affects the discharge rate of NTS CA neurons. A, In an NTS CA neuron that expressed a large IKA (data not shown), injection of constant depolarizing current (+20 pA) at resting potential (−73 mV) evoked a high rate of discharge (A1). In the same neuron after a preconditioning hyperpolarization to −90 mV for 500 ms (−20 pA), the same constant depolarizing current (+20 pA) triggered discharge only after a long delay (A2; arrow indicates delay). B, Conversely, in an NTS CA neuron that expressed a little IKA (data not shown), injection of constant depolarizing current (+45 pA) at resting potential (−70 mV) evoked similar rates of discharge whether from resting potential (B1) or after hyperpolarization (−75 pA) to −90 mV (B2). Timing and directions of current injection steps in these current-clamp recordings are indicated diagrammatically in the lowest traces.
Figure 8.
Figure 8.
Presence of IKA in NTS CA neurons reduces APs generated by ST-activation. A, In a representative NTS CA neuron expressing a large IKA (data not shown) (resting potential, −69 mV), shocks to ST (5 Hz) always evoked an action potential (left, A1; 5 of 5 successes), but, after hyperpolarization (−200 pA) to −100 mV, ST-evoked action potentials were reduced (right, A2; 3 of 5 successes). B, In an NTS CA neuron that expressed a little IKA (data not shown), a similar hyperpolarization preconditioning step to −100 mV (−250 pA) had no effect on ST-evoked action potential successes (right, B1, and left, B2, respectively). Timing and directions of current injection steps in these current-clamp recordings are indicated diagrammatically in the middle traces in which dots indicate shocks to ST.
Figure 9.
Figure 9.
CCK presynaptically increases glutamate release in one-half of NTS CA neurons. In second-order NTS CA neurons (data not shown), mEPSCs were isolated pharmacologically using 1 μm TTX and 2 μm gabazine. CCK (100 nm) increased the rate of mEPSCs in some neurons (neuron A) but not in others (neuron B), and this effect was reversed by a 10 min wash. In CCK-sensitive neurons, CCK increased the frequency of mEPSCs during a 5 min exposure (K–S test, p < 0.05) but did not consistently alter amplitudes (data not shown). Together, these findings suggest that CCK acts presynaptically to increase glutamate release in sensitive neurons. Each bar represents the number of events in a 10 s time period.

References

    1. Andresen MC, Kunze DL. Nucleus tractus solitarius—gateway to neural circulatory control. Annu Rev Physiol. 1994;56:93–116. - PubMed
    1. Andresen MC, Yang M. Dynamics of sensory afferent synaptic transmission in aortic baroreceptor regions of nucleus trachus solitarius. J Neurophysiol. 1995;74:1518–1528. - PubMed
    1. Appleyard SM, Bailey TW, Doyle MW, Jin YH, Smart JL, Low MJ, Andresen MC. Proopiomelanocortin neurons in nucleus tractus solitarius are activated by visceral afferents: regulation by cholecystokinin and opioids. J Neurosci. 2005;25:3578–3585. - PMC - PubMed
    1. Bailey TW, Jin YH, Doyle MW, Andresen MC. Vanilloid-sensitive afferents activate neurons with prominent A-type potassium currents in nucleus tractus solitarius. J Neurosci. 2002;22:8230–8237. - PMC - PubMed
    1. Bailey TW, Jin YH, Doyle MW, Smith SM, Andresen MC. Vasopressin inhibits glutamate release via two distinct modes in the brainstem. J Neurosci. 2006a;26:6131–6142. - PMC - PubMed

Publication types

MeSH terms

LinkOut - more resources