. 2008 Feb;82(3):1259-70.
doi: 10.1128/JVI.01600-07. Epub 2007 Nov 28.

Increased levels of galactose-deficient anti-Gal immunoglobulin G in the sera of hepatitis C virus-infected individuals with fibrosis and cirrhosis

Affiliations

Increased levels of galactose-deficient anti-Gal immunoglobulin G in the sera of hepatitis C virus-infected individuals with fibrosis and cirrhosis

Anand S Mehta et al. J Virol. 2008 Feb.

Abstract

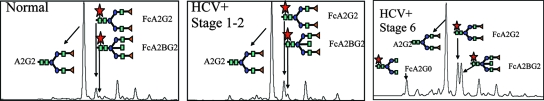
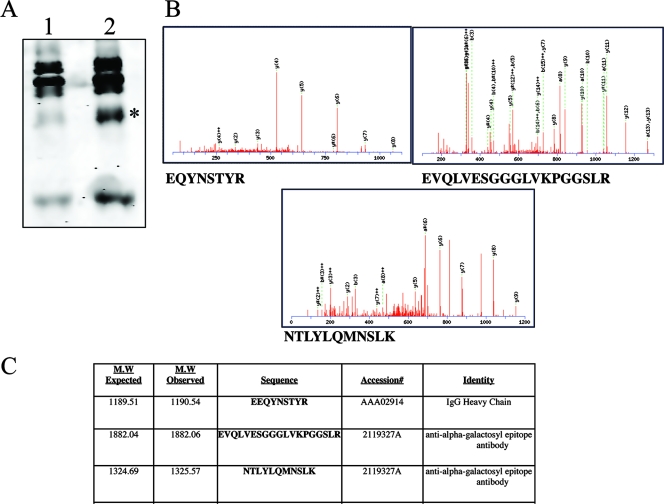
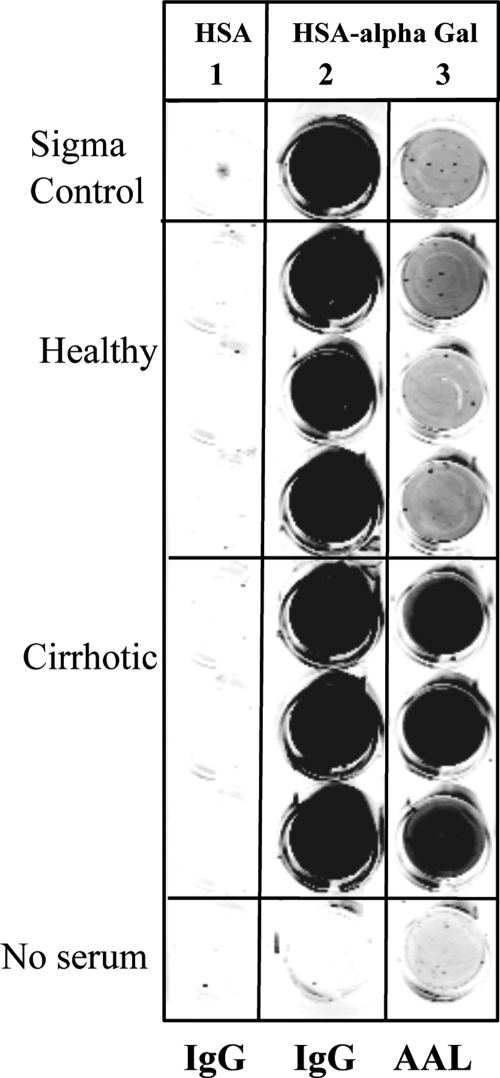
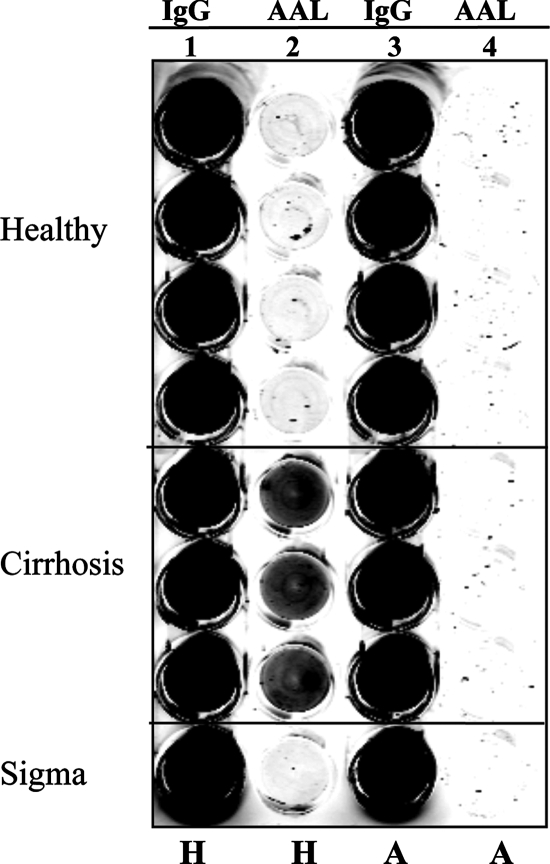
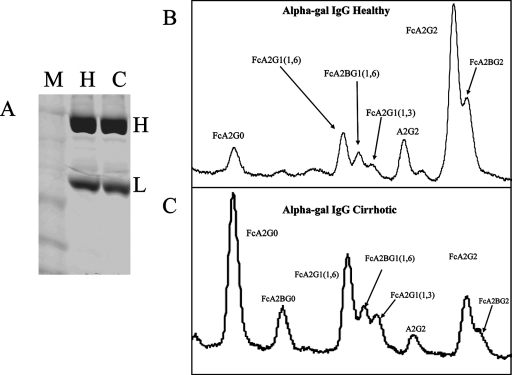
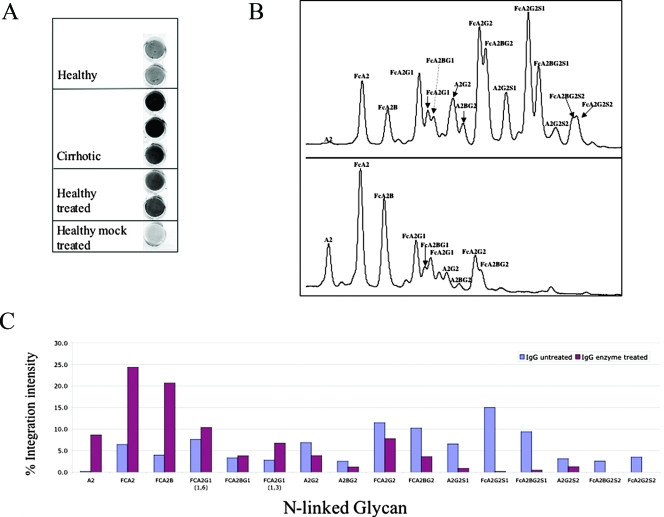
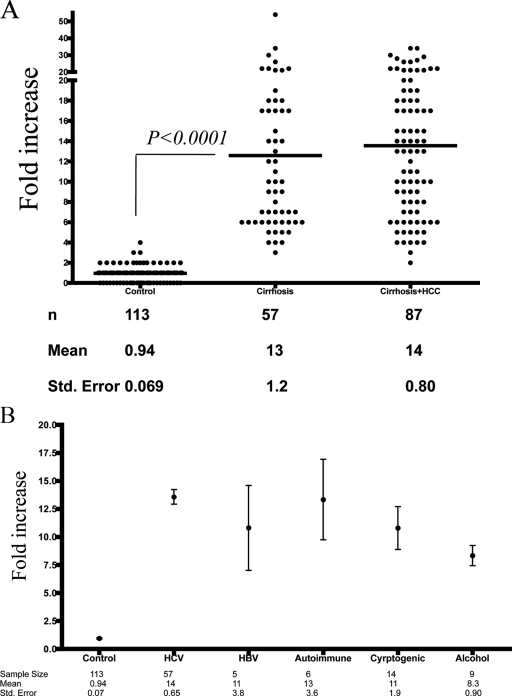
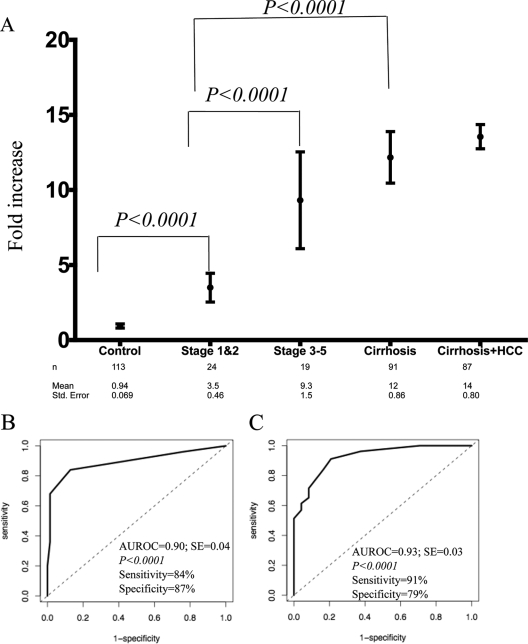
Hepatitis B and C viruses are major causative agents of liver fibrosis, cirrhosis, and liver cancer. Using comparative glycoproteomics, we identified a glycoprotein that is altered both in amount and in glycosylation as a function of liver fibrosis and cirrhosis. Specifically, this altered glycoprotein is an immunoglobulin G (IgG) molecule reactive to the heterophilic alpha-Gal epitope [Galalpha-1-3Galbeta1-(3)4GlcNAc-R]. While similar changes in glycosylation have been observed in several autoimmune diseases, the specific immunoglobulins and their antigen recognition profiles were not determined. Thus, we provide the first report identifying the specific antigenic recognition profile of an immunoglobulin molecule containing altered glycosylation as a function of liver disease. This change in glycosylation allowed increased reactivity with several fucose binding lectins and permitted the development of a plate-based assay to measure this change. Increased lectin reactivity was observed in 100% of the more than 200 individuals with stage III or greater fibrosis and appeared to be correlated with the degree of fibrosis. The reason for the alteration in the glycosylation of anti-Gal IgG is currently unclear but may be related to the natural history of the disease and may be useful in the noninvasive detection of fibrosis and cirrhosis.


Figures

FIG. 1.
FIG. 1.
Evidence that the glycosylation of the human serum glycome is altered with the development of cirrhosis and the identification of anti-Gal IgG as the glycoprotein with the altered glycan. Total serum desialylated glycan profiles from control samples (left), HCV samples with stage 1 and 2 fibrosis (middle), or samples from HCV patients with biopsy-confirmed cirrhosis (stage 5 and 6) are shown. The major peaks of interest are indicated and include a simple biantennary glycan (A2G2), a core fucosylated biantennary glycan (FcA2G2), and a core fucosylated bisected biantennary glycan (FcA2BG2). The cirrhotic samples were from patients with stage 6 fibrosis. The squares represent N-acetylglucosamine monosaccharides (GlcNAc), the circles represent mannose, the triangles represent galactose, and the stars represent fucose.
FIG. 2.
FIG. 2.
Identification of the major lectin-reactive protein(s) in the sera of patients with fibrosis/cirrhosis. (A) The major fucosylated proteins in the sera of cirrhotic patients were identified by extraction of fucosylated proteins from the sera using fucose-specific lectins and analyzed by one-dimensional gel electrophoresis. In lane 1 are the lectin-reactive proteins from healthy individuals; in lane 2 are the lectin-reactive proteins from cirrhotic individuals. The 50-kDa species, which is altered in the two patient groups, is indicated with an asterisk. (B) The 50-kDa species was digested with trypsin, and the protein was identified via LC MS-MS analysis. The MS-MS spectra for the three major peptides identified are shown. (C) The major identified fucosylated proteins observed in cirrhotic samples corresponded to IgG that was reactive to the alpha-Gal epitope.
FIG. 3.
FIG. 3.
Evidence that anti-Gal IgG molecules have altered glycosylation in patients with cirrhosis. Briefly, either HSA (column 1) or synthetic alpha-Gal-linked HSA (columns 2 and 3) was plated onto 96-well plates and incubated with human sera from four healthy control individuals or from three individuals with cirrhosis. The captured IgG was detected by using either anti-human IgG-conjugated secondary antibody (columns 1 and 2) or the fucose-specific lectin AAL (column 3).
FIG. 4.
FIG. 4.
Evidence that only anti-Gal IgG is reactive with fucose binding lectins. Removal of heterophilic alpha-Gal antibodies prevents lectin reactivity of IgGs from cirrhotic patients. IgGs from either healthy individuals or individuals with cirrhosis were captured from sera by using a mouse anti-human IgG antibody. The amount of captured IgG (lane 1) or the level of AAL lectin reactivity (lane 2) was determined as for Fig. 3. Samples were precleared either with HSA (lanes 1 and 2) or with alpha-Gal-HSA (lanes 3 and 4) before analysis. H, precleared with HSA; A, precleared with alpha-Gal-HSA.
FIG. 5.
FIG. 5.
Glycosylation analysis of anti-Gal IgG sfrom healthy or cirrhotic individuals via HPLC-based glycan sequencing. (A) Coomassie staining of anti-Gal IgGs purified from either healthy individuals (H) or cirrhotic individuals (C). The marker lane is also indicated (M). The heavy (H) and light (L) chains are indicated. (B and C) Glycan analysis of the desialylated N-linked glycans associated with the heavy chain from healthy individuals (B) or a cirrhotic individual (C). FcA2G0, core fucosylated (1,6) agalactosylated biantennary glycan; FcA2BG0, core fucosylated (1,6) agalactosylated biantennary glycan with a bisecting GlcNac; FcA2G1(1,6) core fucosylated (1,6) biantennary glycan with a single galatose residue on the 1,6 arm; FcA2BG1(1,6), core fucosylated (1,6) biantennary glycan with a single galatose residue on the 1,6 arm and a bisecting GlcNac; FcA2G2G1(1,3), core fucosylated (1,6) biantennary glycan with a single galatose residue on the 1,3 arm; FcA2G2, core fucosylated biantennary N-glycan (FcA2G2); FcA2BG2, bisected core fucosylated biantennary N-glycan.
FIG. 6.
FIG. 6.
The reactivity of human IgG to the fucose binding lectin AAL is dependent on the type of N-linked glycan attached. (A) IgG from healthy individuals (purchased from Sigma Chemicals) was digested overnight with sialidase (A. ureafaciens) and beta(1-4)-galactosidase (jack bean) to create IgG molecules with the degalactosylated glycans observed in patients with cirrhosis. As a control, a mock sample, treated identically but without enzyme, was used. While IgG purified from healthy individuals had low reactivity with the fucose binding lectin, IgG purified either from cirrhotic individuals or from healthy serum that has been treated with the sialidase and beta-galactosidase had much greater reactivity, indicating that the lectin reactivity is directly associated with the FcA2G0 glycan structure. (B) Glycan analysis of IgG from either mock-treated samples (top) or enzyme-treated samples (bottom) to confirm enzymatic digestion. The major peaks are indicated. For the abbreviations, see the legend to Fig. 5B and C. Additional structures not presented in Fig. 5: A2G2S1, monosialylated biantennary glycan; FCA2G2S1, monosialylated core fucosylated biantennary N-glycan; FCA2BG2S1, monosialylated core fucosylated biantennary glycan with a bisecting GlcNac; A2G2S2, disialylated biantennary glycan; FCA2BG2S2, disialylated core fucosylated biantennary glycan; FcA2BG2S2, disialylated core fucosylated biantennary glycan with a bisecting GlcNac. (C) Quantification of results shown in panel B. The x axis is the glycan structure as detailed in panel B; the y axis is the relative contribution of each glycan structure to the total N-linked glycan profile. Structures are as in panel B.
FIG. 7.
FIG. 7.
Analysis of lectin-reactive IgG in patients with HCV-induced fibrosis and cirrhosis. (A) Scatter plot of control individuals, individuals with HCV-induced cirrhosis, and individuals with HCV-induced cirrhosis plus HCC. The n value, mean, and standard error are provided for each group below the graph. The x axis represents the patient group; the y axis is the increase in lectin-reactive IgG compared to commercially purchased sera. The statistical difference between the HCV-induced cirrhosis group and control subjects was obtained (P < 0.0001; Mann-Whitney test). (B) The levels of lectin-reactive anti-Gal IgG were measured in patients with autoimmune disease-, HBV-, alcohol-, or cryptogenically induced cirrhosis. The n value, mean, and standard error are provided for each group below the graph. The x axis represents the patient group; the y axis is the increase in fucosylated IgG compared to commercially purchased sera. The values for each group are provided as the mean and standard error of the mean. The statistical differences were obtained for all cirrhosis groups and control subjects (P < 0.0001; Mann-Whitney test), but not between individual cirrhotic groups.
FIG. 8.
FIG. 8.
Increase in lectin-reactive anti-Gal IgG with the development of liver fibrosis. (A) Levels of lectin-reactive anti-Gal IgG in the control group and people with stage 1 or 2 fibrosis, stage 3 or 5 fibrosis, and cirrhosis. The mean value for each group is plotted, along with the 95% confidence interval for the mean. The x axis represents the patient group; the y axis is the increase in lectin-reactive IgG compared to commercially purchased serum. The n value, mean, and standard error are provided for each group below the graph. All patients with cirrhosis (from Fig. 5A and B) are included. (B) ROC analysis comparing people with stage 1 and 2 fibrosis with the control group. Using an optimal cutoff of threefold above commercially purchased sera, fucosylated immunoglobulin had a sensitivity of 84% and a specificity of 87%. (C) ROC analysis comparing stage 1 and 2 fibrosis with stage 3 and 6 fibrosis/cirrhosis. Using an optimal cutoff of fivefold above commercially purchased sera, fucosylated immunoglobulin had a sensitivity of 91% and a specificity of 79%. AUROC, area under the ROC curve.

References

    1. Alter, M. J. 1997. Epidemiology of hepatitis C. Hepatology 2662S-65S. - PubMed
    1. Arnold, J. N., M. R. Wormald, R. B. Sim, P. M. Rudd, and R. A. Dwek. 2006. The impact of glycosylation on the biological function and structure of human immunoglobulins. Annu. Rev. Immunol. 2521-50. - PubMed
    1. Block, T. M., M. A. Comunale, M. Lowman, L. F. Steel, P. R. Romano, C. Fimmel, B. C. Tennant, W. T. London, A. A. Evans, B. S. Blumberg, R. A. Dwek, T. S. Mattu, and A. S. Mehta. 2005. Use of targeted glycoproteomics to identify serum glycoproteins that correlate with liver cancer in woodchucks and humans. Proc. Natl. Acad. Sci. USA 102779-784. - PMC - PubMed
    1. Callewaert, N., H. Van Vlierberghe, A. Van Hecke, W. Laroy, J. Delanghe, and R. Contreras. 2004. Noninvasive diagnosis of liver cirrhosis using DNA sequencer based total serum protein glycomics. Nat. Med. 10429-434. - PubMed
    1. Comunale, M. A., M. Lowman, R. E. Long, J. Krakover, R. Philip, S. Seeholzer, A. A. Evans, H. W. L. Hann, T. M. Block, and A. S. Mehta. 2006. Proteomic analysis of serum associated fucosylated glycoproteins in the development of primary hepatocellular carcinoma. J. Proteome Res. 6308-315. - PubMed

Publication types