. 2008 Feb;19(2):572-86.
doi: 10.1091/mbc.e07-06-0587. Epub 2007 Nov 28.

Sequestration of mutated alpha1-antitrypsin into inclusion bodies is a cell-protective mechanism to maintain endoplasmic reticulum function

Affiliations

Sequestration of mutated alpha1-antitrypsin into inclusion bodies is a cell-protective mechanism to maintain endoplasmic reticulum function

Susana Granell et al. Mol Biol Cell. 2008 Feb.

Abstract

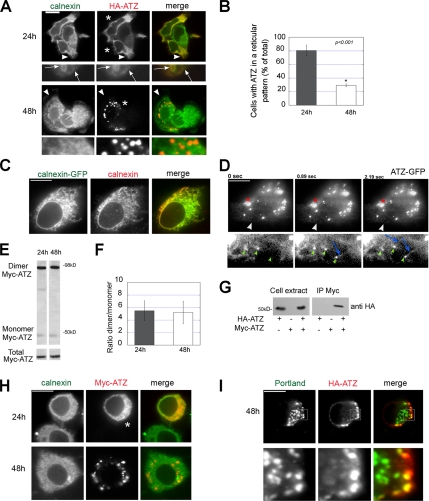
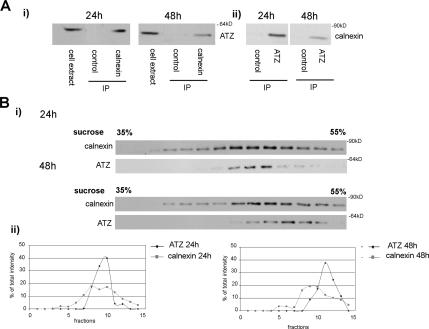
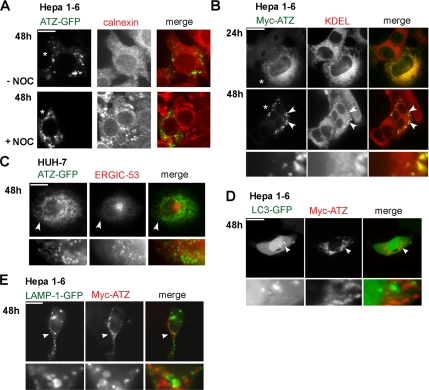
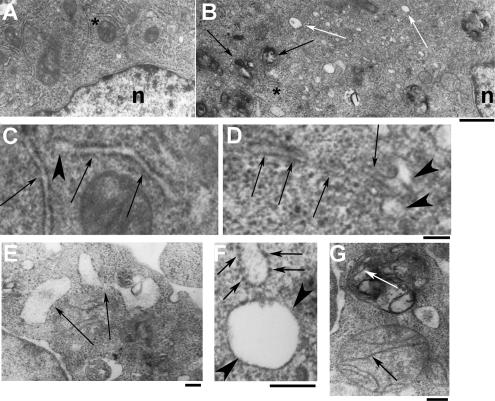
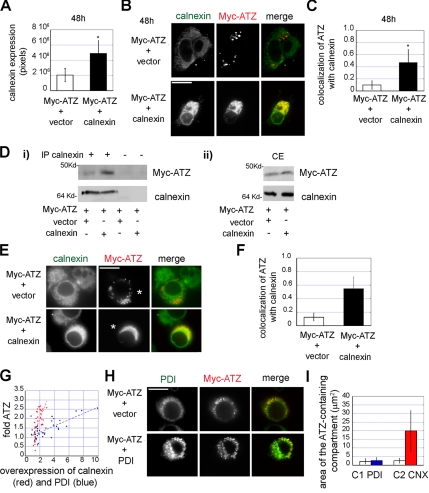
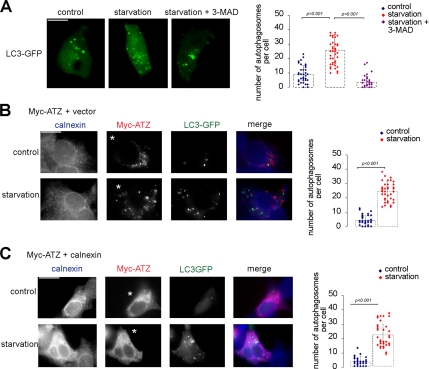
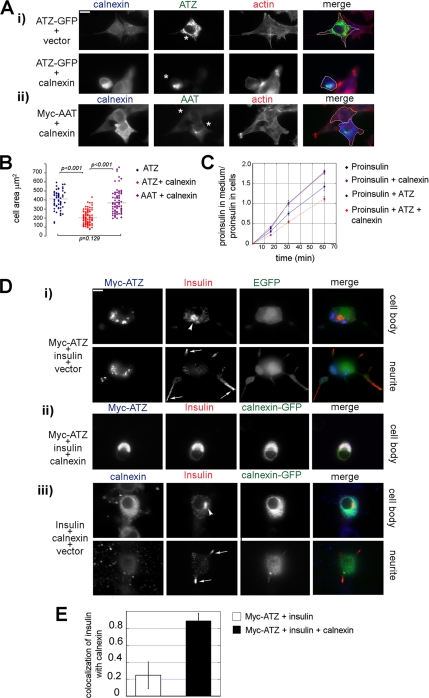
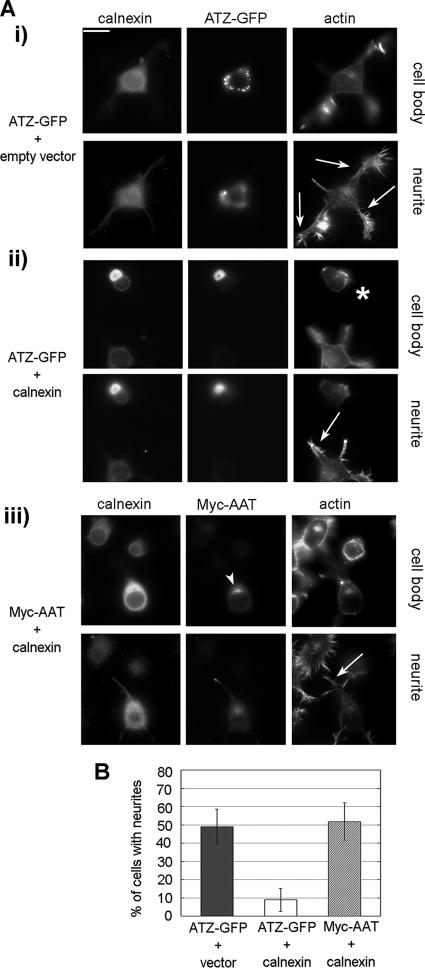
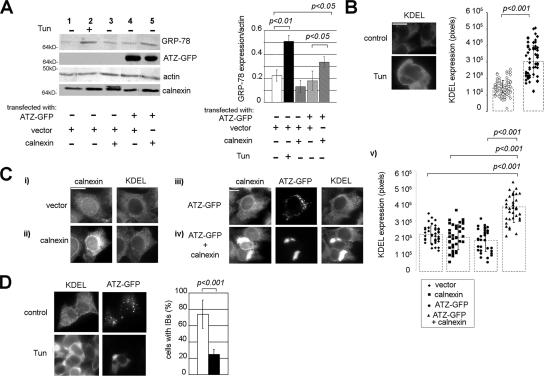
A variant alpha1-antitrypsin with E342K mutation has a high tendency to form intracellular polymers, and it is associated with liver disease. In the hepatocytes of individuals carrying the mutation, alpha1-antitrypsin localizes both to the endoplasmic reticulum (ER) and to membrane-surrounded inclusion bodies (IBs). It is unclear whether the IBs contribute to cell toxicity or whether they are protective to the cell. We found that in hepatoma cells, mutated alpha1-antitrypsin exited the ER and accumulated in IBs that were negative for autophagosomal and lysosomal markers, and contained several ER components, but not calnexin. Mutated alpha1-antitrypsin induced IBs also in neuroendocrine cells, showing that formation of these organelles is not cell type specific. In the presence of IBs, ER function was largely maintained. Increased levels of calnexin, but not of protein disulfide isomerase, inhibited formation of IBs and lead to retention of mutated alpha1-antitrypsin in the ER. In hepatoma cells, shift of mutated alpha1-antitrypsin localization to the ER by calnexin overexpression lead to cell shrinkage, ER stress, and impairment of the secretory pathway at the ER level. We conclude that segregation of mutated alpha1-antitrypsin from the ER to the IBs is a protective cell response to maintain a functional secretory pathway.


Figures

Figure 1.
Figure 1.
ATZ accumulates in IBs in a time-dependent manner in different cell types. (A) In Hepa 1-6 cells, ATZ localizes to the ER at 24 h after transfection and in IBs 48 h after transfection. Cells were transiently transfected with HA-ATZ-pcDNA3.1 and analyzed by confocal fluorescence microscopy at 24 and 48 h after transfection. Cells were costained with primary rabbit polyclonal antibodies against calnexin to label the ER and mouse monoclonal antibodies against the HA tag. Secondary antibody staining was carried out using FITC-conjugated anti-rabbit antibodies and Cy3-conjugated anti-mouse antibodies. Magnified images (10×) of the regions at the arrowheads are shown in bottom panels. Arrows indicate colocalization of ATZ with calnexin. Asterisks indicate transfected cells. (B) Quantification of cells with ATZ in the ER. To quantify the percentage of cells that have ATZ in the ER, confocal images of 50 cells per time (24 and 48 h) were analyzed. The cells were classified into two groups, either with ATZ in a reticular pattern or with at least one IB. Averages and standard deviations were obtained from the experiment shown in A (n = 50 cells per time). (C) Immunofluorescence images of Hepa 1-6 cells transiently transfected with calnexin-GFP and stained with primary rabbit polyclonal antibodies against calnexin. Secondary antibody staining was carried out using Cy3-conjugated anti-rabbit antibodies. (D) Hepa 1-6 cells were transiently transfected with ATZ-GFP. Approximately 48 h after cell transfection, cells were imaged by TIRFM by using time-lapse acquisition. Bottom, magnified image (10×) of the regions at the arrowheads. Green small arrowheads indicate small round ATZ accumulations at the tip of ATZ-labeled tubules (blue arrows). The red asterisk shows an IB. (E) SDS-page in denaturing (bottom inset) and nondenaturing conditions (top inset) of ATZ cell lysates 24 and 48 h after transfection with Myc-ATZ-pcDNA3.1. Western blots were probed with mouse monoclonal anti-AAT antibody. (F) Averages and standard deviations are derived from three independent samples including that in E. (G) Hepa 1-6 cell lysates were derived from cells transfected with either HA-ATZ-pcDNA3.1, or Myc-ATZ-pcDNA3.1, or both, as indicated. Immunoprecipitations from cell lysates were carried out with anti-Myc antibodies. Immunoprecipitated samples were analyzed by Western blot by using POD-labeled anti-HA antibody. (H) In neuroblastoma N2A cells ATZ localized to the ER and accumulated in IBs at 24 and 48 h after cell transfection, respectively. Confocal microscopy of N2A cells transiently transfected with Myc-ATZ-pcDNA3.1. Cells were costained with rabbit polyclonal antibodies against calnexin and with mouse monoclonal antibodies against the Myc-tag. Secondary antibody staining was carried out using FITC-conjugated anti-rabbit antibodies and Cy3-conjugated anti-mouse antibodies. Asterisks indicate transfected cells. (I) Neuroserpin Portland colocalizes with ATZ. N2A cells were cotransfected with HA-ATZ-pcDNA3.1 and neuroserpin Portland-pcDNA3.1. Confocal microscopy of cells stained with rabbit polyclonal antibodies against neuroserpin and mouse monoclonal anti-HA antibody. Secondary antibody staining was done as in A. Bottom, magnified image (5×) of a region (square) in the top panel. Bars, 25 μm.
Figure 2.
Figure 2.
ATZ migrates as a separate peak from calnexin-containing ER in a sucrose density gradient. (A) Decreased binding of ATZ to calnexin at the 48 h compared with the 24-h time points. i, immunoprecipitations of lysates derived from Hepa 1-6 cells expressing ATZ-GFP were carried out without (control) and with calnexin antibody. Immunoprecipitates were analyzed by Western blot by using mouse monoclonal antibodies against AAT. ii, immunoprecipitations of the same samples were carried out without (control) and with AAT antibody. Immunoprecipitates were analyzed by Western blot by using rabbit polyclonal antibodies against calnexin. (B) Twenty-four and 48 h after tranfection of Hepa 1-6 cells with ATZ-GFP, postnuclear supernatants were collected and loaded in parallel onto sucrose density gradients. Fractions were analyzed by Western blot by using antibodies against AAT and calnexin.
Figure 3.
Figure 3.
IBs show up as separated from the main ER, do not have autophagosome or lysosome markers, and retain some ER proteins. (A) Treating Hepa 1-6 cells with nocodazole disrupts the ER, and it does not change ATZ distribution in the IBs. Hepa 1-6 cells were transiently transfected with ATZ-GFP and incubated without (−Noc) and with nocodazole (+Noc) at the 48-h times after transfection. Cells were stained with rabbit polyclonal antibodies against calnexin. Secondary antibody staining was carried out using Cy3-conjugated anti-rabbit secondary antibody. Asterisks indicate transfected cells. (B) ATZ in the IBs colocalizes with KDEL sequence-containing proteins. Confocal microscopy of Hepa 1-6 cells transiently transfected with Myc-ATZ-pcDNA3.1. Cells were costained with rabbit polyclonal antibodies against the Myc-tag and the mouse monoclonal antibodies against KDEL. FITC-conjugated anti-rabbit and Cy3-conjugated anti-mouse antibodies were used for secondary staining. The lowest panel has a magnified image (6×) of a region (arrowheads) in the top panel. Asterisks indicate transfected cells. (C) ATZ in the IBs does not localize to the ER-to-Golgi intermediate compartment. Huh-7 cells were transfected with ATZ-GFP and stained using primary mouse monoclonal antibodies against ERGIC-53 and secondary Cy3-conjugated anti-mouse antibodies. Bottom, magnified image (4×) of the region indicated by the arrowhead. (D) ATZ in IBs does not colocalize with the autophagosomal marker LC3-GFP. Hepa 1-6 cells were cotransfected with LC3-GFP and Myc-ATZ-pcDNA3.1 and stained using primary mouse monoclonal antibodies against the Myc-tag and secondary Cy3-conjugated anti-mouse antibodies. Bottom, magnified image (6×) of the region indicated by the arrowhead. (E) ATZ in the IBs does not colocalize with the lysosomal marker LAMP1-GFP. Hepa 1-6 cells were cotransfected with LAMP1-GFP and Myc-ATZ-pcDNA3.1 and stained as described in D. Bottom, magnified detail (6×) of the image shown above and indicated by the arrowhead. Bars, 25 μm.
Figure 4.
Figure 4.
Ultrastructural analysis of Hepa 1-6 cells expressing ATZ. (A and B) Micrographs of control cells (A) and ATZ-expressing cells (B) at the same magnification. B, white arrows and black arrows indicate electron-light and electron-dense organelles. Bar, 1 μm; n, nucleus. (C and D) The fields indicated by the asterisks in the control (A) and ATZ-expressing cells (B) are shown at higher magnification in C and D, respectively. Arrows in C and D indicate the ER; arrowheads indicate the tips of ER cisternae. Bar, 200 nm; C and D are at the same magnification. (E–G) Micrographs of ATZ expressing cells. Bars, 200 nm. Large electron-light bodies limited by one membrane (arrows) are shown in E. A vesicle with attached ribosomes is shown in F (arrows) next to another one without ribosomes (arrowheads). A mitochondrium is shown in G with intact cristae (black arrow) next to an electron-dense body where disrupted cristae are still visible (white arrow).
Figure 5.
Figure 5.
Calnexin and not PDI, controls formation of IBs. (A) Hepa 1-6 cells were cotransfected with Myc-ATZ-pcDNA 3.1 and either empty pcDNA3.1 vector or calnexin-pcDNA3.1, as indicated. In the transfected cells, the levels of calnexin (averages and standard deviations) are derived from 40 cells per condition at the 48 h time. (B) Confocal images showing the shift of ATZ labeling from IBs to the ER in Hepa 1-6 cell without (top) and with exogenous calnexin (bottom), 48 h after cell transfection. Cells were costained with primary mouse monoclonal antibodies against the Myc-tag and rabbit polyclonal antibodies against calnexin. Secondary antibody staining was carried out using Cy3-conjugated anti-mouse and FITC-conjugated anti-rabbit antibodies. (C) Increased colocalization of ATZ with calnexin at the 48-h time in cells overexpressing calnexin (n = 40) compared with the control with endogenous calnexin (n = 40). (D) Cell lysates were derived from Hepa 1-6 cells transfected with either Myc-ATZ-pcDNA3.1 and empty pcDNA3.1 (vector) or cotransfected with Myc-ATZ-pcDNA3.1 and calnexin-pcDNA3.1 48 h after transfection. Immunoprecipitations were carried out without and with rabbit polyclonal anti-calnexin antibodies, as indicated. Immunoprecipitates and cell lysates (CE) were analyzed by Western blot by using mouse monoclonal anti-Myc and rabbit polyclonal anti-calnexin antibodies. (E) In N2A cells increased calnexin levels lead to a shift of ATZ distribution from IBs to the ER. N2A cells were cotransfected with Myc-ATZ-pcDNA3.1 and either empty pcDNA3.1 vector (top) or calnexin-pcDNA3.1 (bottom). For confocal microscopy, cells were costained as described in B. Asterisks indicate transfected cells. (F) Increased colocalization of ATZ with calnexin in cells overexpressing calnexin (n = 30) compared with the control without exogenous calnexin (n = 30) at the 48-h time. (G) Cells were cotransfected with Myc-ATZ-pcDNA3.1 and either PDI-pCMV-SPORT6 or calnexin-pcDNA3.1. The graph shows levels of intracellular ATZ (-fold ATZ) in individual cells overexpressing either calnexin (n = 34) or PDI (n = 41). (H) Confocal images of N2A cells cotransfected with Myc-ATZ-pcDNA3.1 and either empty pcDNA3.1 vector (top) or PDI-pCMV-SPORT6 (bottom). Cells were costained with primary mouse monoclonal anti-PDI and rabbit polyclonal anti-Myc antibodies. Secondary staining was carried out using FITC-conjugated anti-mouse and Cy3-conjugated anti-rabbit secondary antibodies. (I) N2A cells were transfected as described in G. The graph shows the area of the ATZ containing compartment in cells with ATZ alone (C1; n = 15) or with ATZ + exogenous PDI (PDI; n = 15) or with ATZ alone (C2; n = 15) and ATZ + exogenous calnexin (CNX; n = 15). Bars, 25 μm.
Figure 6.
Figure 6.
Hepa 1-6 cells are capable of a classical autophagy response. (A) Amino acid deprivation induces autophagy in Hepa 1-6 cells. Cells were transiently transfected with LC3-GFP. Induction of autophagy was inhibited by using 3-methyl-adenine (MAD). Averages and standard deviations shown in the graph were obtained from the experiment in the left panel (n = 45). (B) LC3-GFP does not localize to IBs when autophagy is induced. Hepa 1-6 cells were cotransfected with Myc-ATZ-pcDNA3.1 and LC3-GFP. Immunostaining was done using the rabbit polyclonal antibody against calnexin and mouse monoclonal against the Myc-tag. Secondary staining was carried out using Cy5-conjugated anti-rabbit and Cy3-conjugate anti-mouse antibodies. Averages and standard deviations shown in the graph were obtained from the experiment in the left panel (n = 45). Asterisks indicate transfected cells. (C) Inhibition of IB formation by calnexin overexpression occurs in cells capable of autophagy. Hepa 1-6 cells were cotransfected with Myc-ATZ-pcDNA3.1, calnexin-pcDNA3.1, and LC3-GFP. Immunostaining was done as described in B. Averages and standard deviations shown in the graph were obtained from the experiment in the left panel (n = 45). Asterisks indicate transfected cells.
Figure 7.
Figure 7.
Inhibition of IB formation causes shrinkage in Hepa 1-6 cells and impairs constitutive exocytosis. (A) Increased levels of calnexin induce cell shrinkage in ATZ expressing cells. i, cells were cotransfected with ATZ-GFP and either empty pcDNA3.1 vector or calnexin-pcDNA3.1. Cells were costained with antibodies against calnexin and with the F-actin binding dye Alexa Fluor-Phalloidin. Secondary antibody staining was carried out using Cy5-conjugated anti-rabbit secondary antibodies. ii, Hepa 1-6 cells were cotransfected with Myc-AAT-pcDNA3.1 and calnexin-pcDNA3.1. Staining was done using rabbit polyclonal anti-calnexin and mouse monoclonal anti-Myc antibodies and Alexa Fluor-Phalloidin. Secondary staining was carried out using Cy5-conjugated anti-rabbit antibodies and FITC-conjugate anti-mouse. Asterisks indicate transfected cells, and cell outlines are traced in the merged image following the F-actin staining. (B) Area of cells expressing ATZ-GFP (n = 63), ATZ-GFP and exogenous calnexin (n = 105), and Myc-AAT and exogenous calnexin (n = 86). Calnexin overexpression was calculated by the following ratio: total pixel intensity of calnexin (blue channel) in transfected cells/total pixel intensity of calnexin (blue channel) in the neighboring nontransfected cells (n = 3 for each transfected cell). Overexpression of calnexin in the group of cells expressing ATZ and exogenous calnexin was 2.02 ± 0.83 and in the group of cells expressing AAT and exogenous calnexin was 2.32 ± 0.75. (C) Constitutive secretion is profoundly impaired in hepatoma cells coexpressing ATZ and exogenous calnexin. Hepa 1-6 cells were transfected with either proinsulin-pcDNA3.1 or with proinsulin-pcDNA3.1 and calnexin-pcDNA3.1, or with proinsulin-pcDNA3.1 and ATZ-GFP or with proinsulin-pcDNA3.1, ATZ-GFP and calnexin-pcDNA3.1, as indicated. Proinsulin secretion was calculated using the following ratio: proinsulin in the medium (pM)/proinsulin in the cell lysate (pM). (D) Overexpression of calnexin in ATZ-expressing cells blocks the secretory pathway at the ER level. Epifluorescence images were taken 48 h after cell transfection. i, N2A cells were cotransfected with Myc-ATZ-pcDNA3.1, proinsulin-pcDNA3.1, and empty GFP vector. Cell body and neurites were visualized at two focal planes as indicated. Insulin localizes in a Golgi-like compartment (arrowhead) and to dense core granules at the tips of the neurites (arrows). Cells were costained with the mouse monoclonal antibodies against the Myc-tag and rabbit polyclonal antibodies against insulin. Secondary staining was done with Cy5-conjugated anti-mouse and Cy3-conjugated anti-rabbit antibodies. ii, N2A cells were cotransfected with Myc-ATZ-pcDNA3.1, proinsulin-pcDNA3.1, and calnexin-GFP. Cells were costained as described in i. iii, N2A cells were transfected with proinsulin-pcDNA3.1, empty pcDNA3.1 vector, and calnexin-GFP. Cells were costained with the mouse monoclonal anti-insulin and the rabbit polyclonal anti-calnexin. Secondary staining was done with Cy3-conjugated anti-mouse and the Cy5-conjugated anti-rabbit antibodies. Insulin localized to the Golgi-like compartment (arrowhead), and to dense core granules at the tip of the neurite (arrows) as shown in i. (E) Colocalization of ATZ with insulin is increased in the cells overexpressing calnexin (n = 30) compared with the control (GFP) with ATZ alone (n = 30). Averages and standard deviations are derived from the experiment shown in D. Bars, 25 μm.
Figure 8.
Figure 8.
Block of IB formation inhibits neurite outgrow in neuroblastoma cells. (A) Epifluorescence images were taken 48 h after cell transfection. Neurite outgrowth was induced by incubating cells in the absence of serum for 24 h. The two panels represent two different focal planes of the same cell. i, N2A cells were cotransfected with ATZ-GFP and empty pcDNA3.1 vector. Cells were stained with rabbit polyclonal antibodies against calnexin and Alexa Fluor-Phalloidin to label F-actin and visualize neurites (arrows). Secondary staining was carried out using Cy5-conjugated anti-rabbit antibodies. ii, N2A cells were transfected with ATZ-GFP and calnexin-pcDNA3.1. Asterisk, transfected cell; arrows, neurites of nontransfected cells. Cells were stained as described in i. iii, N2A cells were cotransfected with Myc-AAT-pcDNA3.1 and calnexin-pcDNA3.1. Cells were costained with rabbit polyclonal antibodies against calnexin, mouse monoclonal antibodies against the Myc-tag, and Alexa Fluor-Phalloidin. Secondary staining was carried out using Cy5-conjugated anti-rabbit and FITC-conjugated anti-mouse antibodies. Bar, 25 μm. (B) Percentage of N2A cells with neurites in cells expressing ATZ-GFP (n = 54); ATZ-GFP and calnexin (n = 54); and Myc-AAT and calnexin (n = 39). Overexpression of calnexin in the group of cells expressing ATZ and exogenous calnexin was 1.67 ± 0.54 and in the group of cells expressing AAT and exogenous calnexin was 1.87 ± 0.73. Calnexin overexpression was measured as in Figure 7B.
Figure 9.
Figure 9.
Formation of IBs prevents induction of the UPR. (A) Hepa 1-6 cells were transfected as indicated and treated in the absence and in the presence of tunicamycin (Tun). Cell lysates were analyzed by Western blot by using the indicated antibodies. Right, GRP-78/BiP and actin levels were measured by densitometry. Averages and standard deviations were determined from three independent samples including that shown in the left panel. (B) Tunicamycin increased KDEL immunoreactivity in Hepa 1-6 cells. Left, cell immunostaining was done using the mouse monoclonal antibodies against KDEL. Secondary staining was carried out using Cy3-conjugated anti-mouse antibody. Right, averages and standard deviations of KDEL immunoreactivity were measured by quantitative fluorescence microscopy of 75 cells per condition. Cells were from the experiment shown in the left panel. (C) i and ii, Hepa 1-6 cells were transfected with empty pcDNA3.1 (vector) or with calnexin-pcDNA3.1 and costained with the mouse monoclonal antibodies against KDEL and rabbit polyclonal antibodies against calnexin. Secondary staining was carried out using Cy3-conjugate anti-mouse and Cy5-conjugate anti-rabbit antibodies. iii and iv, cells were transfected with ATZ-GFP and pcDNA3.1 or with ATZ-GFP and calnexin-pcDNA3.1. Cells were stained as described in i. v, graph shows averages and standard deviations of KDEL pixel intensity in cells (n = 45 cells per condition) from the experiment shown in i–iv. (D) Induction of ER stress by tunicamycin inhibits IBs formation. Hepa 1-6 cells were transfected with ATZ-GFP and treated in the absence and in the presence of tunicamycin. Cells were immunostained as described in B. For the quantification shown in the graph, we measured the percentage of cells that had 1 or more IB (n = 100 cells per condition).

References

    1. Arrasate M., Mitra S., Schweitzer E. S., Segal M. R., Finkbeiner S. Inclusion body formation reduces levels of mutant huntingtin and the risk of neuronal death. Nature. 2004;431:805–810. - PubMed
    1. Baldini G., Martelli A. M., Tabellini G., Horn C., Machaca K., Narducci P., Baldini G. Rabphilin localizes with the cell actin cytoskeleton and stimulates association of granules with F-actin cross-linked by α-actinin. J. Biol. Chem. 2005;280:34974–34984. - PubMed
    1. Baldini G., Wang G., Weber M., Zweyer M., Bareggi R., Witkin J. W., Martelli A. M. Expression of Rab3D N135I inhibits regulated secretion of ACTH in AtT-20 cells. J. Cell Biol. 1998;140:305–313. - PMC - PubMed
    1. Bennett E. J., Bence N. F., Jayakumar R., Kopito R. R. Global impairment of the ubiquitin-proteasome system by nuclear or cytoplasmic protein aggregates precedes inclusion body formation. Mol Cell. 2005;17:351–365. - PubMed
    1. Cabral C. M., Choudhury P., Liu Y., Sifers R. N. Processing by endoplasmic reticulum mannosidases partitions a secretion-impaired glycoprotein into distinct disposal pathways. J. Biol. Chem. 2000;275:25015–25022. - PubMed

Publication types

MeSH terms

LinkOut - more resources