. 2008 Feb;99(2):787-98.
doi: 10.1152/jn.00658.2007. Epub 2007 Nov 28.

Fine detail of neurovascular coupling revealed by spatiotemporal analysis of the hemodynamic response to single whisker stimulation in rat barrel cortex

Affiliations

Fine detail of neurovascular coupling revealed by spatiotemporal analysis of the hemodynamic response to single whisker stimulation in rat barrel cortex

J Berwick et al. J Neurophysiol. 2008 Feb.

Abstract

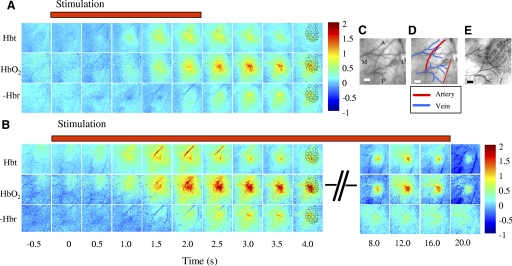
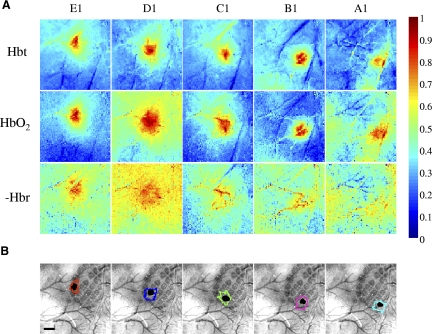
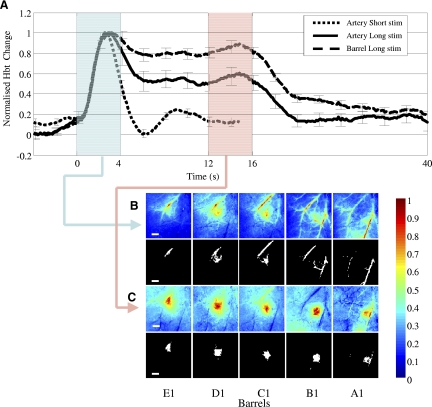
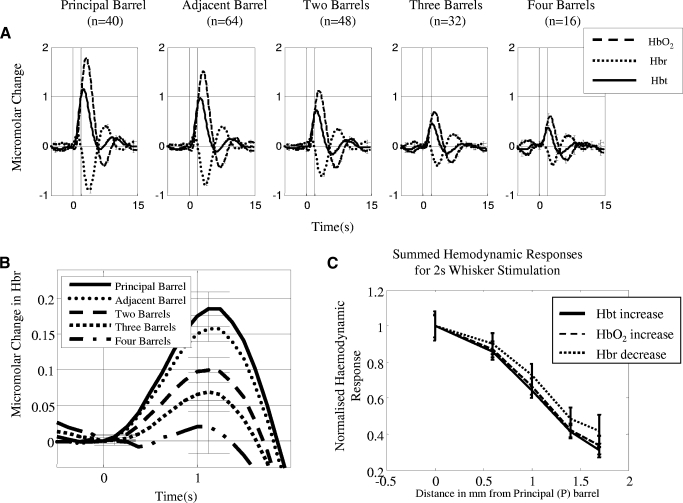
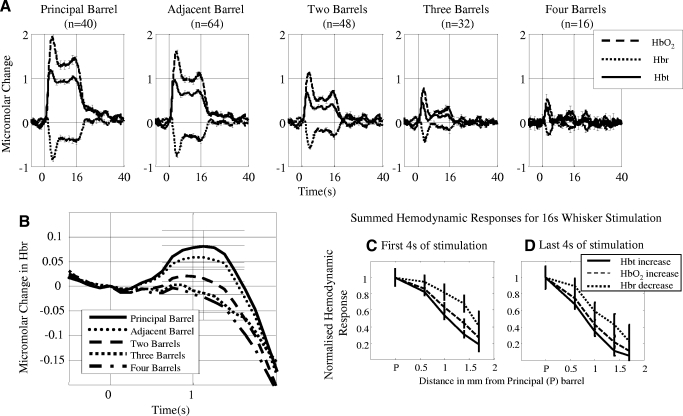
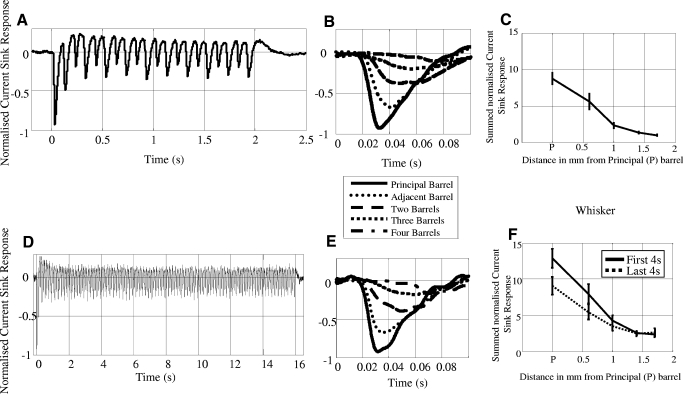
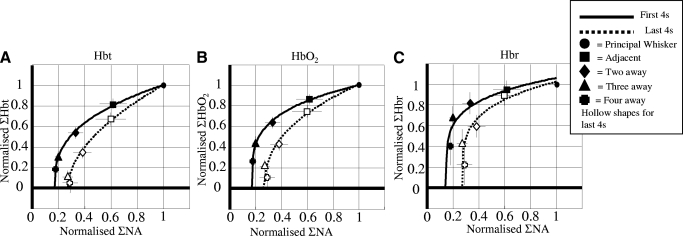
The spatial resolution of hemodynamic-based neuroimaging techniques, including functional magnetic resonance imaging, is limited by the degree to which neurons regulate their blood supply on a fine scale. Here we investigated the spatial detail of neurovascular events with a combination of high spatiotemporal resolution two-dimensional spectroscopic optical imaging, multichannel electrode recordings and cytochrome oxidase histology in the rodent whisker barrel field. After mechanical stimulation of a single whisker, we found two spatially distinct cortical hemodynamic responses: a transient response in the "upstream" branches of surface arteries and a later highly localized increase in blood volume centered on the activated cortical column. Although the spatial representation of this localized response exceeded that of a single "barrel," the spread of hemodynamic activity accurately reflected the neural response in neighboring columns rather than being due to a passive "overspill." These data confirm hemodynamics are capable of providing accurate "single-condition" maps of neural activity.


Figures

FIG. 1.
FIG. 1.
The hemodynamic response for short (2 s) and long (16 s) whisker C1 stimulation. A: image montage for total blood volume (Hbt), oxyhaemoglobin (HbO2) and deoxyhemoglobin (Hbr) for short stimulation of whisker C1. The scale bar represents the micromolar change from baseline. Stimulation occurs at time 0. Both Hbt and HbO2 increase after stimulus onset, Hbr decreases (Hbr has been inverted so decreases appear as red regions). The Hbt increase is localized to the area surrounding barrel C1 and a branch of the middle cerebral artery lying anterior to it. The HbO2 response is less localized than Hbt and after 3.5 s is localized to the draining veins. The Hbr decrease is also localized to the draining veins. B: image montage for Hbt, HbO2 and Hbr for long stimulation of whisker C1. The onset responses for the long duration stimulation are similar to the short duration albeit at a slightly larger magnitude. For Hbt as the arterial response returns to baseline after 3 s a very localized region remains for the duration of the stimulation period, that overlies the whisker C1 barrel region. HbO2 is less localised than Hbt and is biased towards the draining veins and the Hbr decrease remains localized to the draining veins. C: and D: in vivo images of the surface vasculature show the branches of the middle cerebral artery (MCA) and draining veins. E: the relationship of the barrel cortex to the surface vasculature is shown in a combined post mortem image. This post mortem image was fitted to the in vivo image so that the barrels could then be superimposed over the activation maps as a reference (these are shown in the images 4 s after stimulation onset). Scale bar = 500 μm. M, medial; L, lateral; A, anterior; P, posterior.
FIG. 2.
FIG. 2.
Hemodynamic responses for total blood volume (Hbt), oxyhemoglobin (HbO2) and deoxyhemoglobin (Hbr) for long duration stimulation of whiskers A1–E1. A: shows normalised mean response images for Hbt, HbO2 and the inverse of Hbr taken from 12–16 s after stimulation onset. The most localized responses are from the Hbt data. B: combined surface and barrel histological sections with the stimulated barrel highlighted in black. The contour round each stimulated barrel is the activated Hbt region calculated by including all pixels with 50% of the peak response from a mean image of the last 4 s of stimulation. Scale bar = 500 μm.
FIG. 3.
FIG. 3.
Transient arterial response. A: normalised average (across all barrel experiments) total blood volume (Hbt) times series responses for an artery region for short (2 s) and long (16 s) duration stimulation and Hbt time series for long stimulation taken from the barrel region, (mean of 40 barrels from 8 rats, error bars = SE). The transient nature of the arterial response is independent of stimulus duration, whereas the Hbt response from the barrel remains elevated for the period of stimulation. Highlighted regions are the time where the average was taken to produce the images in B and C. B: normalized average Hbt images and activated image region masks selected for subsequent analysis taken from the first 4 s after stimulus onset from the representative animal shown in Figs. 1 and 2. The masks were calculated by including all pixels with 50% of the peak response. For all whiskers stimulated the initial response is localized to branches of the MCA. C: normalised average Hbt images and activated image region masks taken from 12–16 s of the stimulation period again from the same representative animal shown in Figs. 1 and 2. These responses are localised to the individual barrel columns. Scale bar = 500 μm.
FIG. 4.
FIG. 4.
Average Micromolar time series changes from all experiments in total blood volume (Hbt), oxyhemoglobin (HbO2) and deoxyhemoglobin (Hbr) for short whisker stimulation as a function of distance relative to the principal barrel. A: responses for short (2 s) stimulus duration. The response can be characterized for all whiskers as a monophasic increase in Hbt and HbO2, with a transient increase in Hbr that the decreases below baseline. The size of the response is largest for the principal barrel and smallest for the barrel which is 4-distant. B: transient increase in deoxyhemoglobin for short (2 s) stimulation. The largest increase is from the principal barrel and the smallest in the barrel 4-distant. C: normalized hemodynamic response measurements for short duration stimulation. All aspects of the hemodynamic response decrease as a function of cortical distance.
FIG. 5.
FIG. 5.
Average Micromolar time series changes from all experiments in total blood volume (Hbt), oxyhemoglobin (HbO2) and deoxyhemoglobin (Hbr) for long whisker stimulation as a function of distance relative to the principal barrel. A: responses for long (16 s) stimulus duration. These responses can be characterized for Hbt and HbO2 as initial increases followed by a plateau phase that lasts for the duration of stimulation. For Hbr again there was a transient increase followed by a decrease below baseline and then a continued plateau below baseline for the duration of the stimulation period. (Error bars = SE). B: transient increase in deoxyhemoglobin for long (16 s) stimulation. The largest increase is from the principal barrel and the smallest in the barrel 4-distant. C: normalized hemodynamic response measurements for the first 4 s of long duration stimulation. D: normalized hemodynamic response measurements for the last 4 s of long duration stimulation. Although the results for the first and last 4 s are similar to the short stimulation there are differences. In both conditions the sharpest decline (smaller proportional response size) as a function of distance is from the Hbt measurement. The responses for all three variables decrease more sharply for the last 4 s of stimulation compared to the first 4 s.
FIG. 6.
FIG. 6.
Averaged evoked neural response using current source density sinks (CSD-Sink) time series for short (2 s) and long (16 s) whisker stimulation normalized with respect to the first impulse response on the principal whisker (n = 10 animals). A: CSD-Sink time series for short stimulation from the principal barrel. B: enlarged image of the first impulse response for the short stimulation for all five whiskers. The largest response was from the principal barrel and smallest from the barrel 4-distant C: summed CSD-Sink activity for the short stimulus duration, this measure was taken from the sum of all deflections (±SE). The response magnitude decreases as a function of cortical distance. D: CSD-Sink time series for long stimulation from the principal barrel. E: enlarged image of the first impulse response for the long stimulation for all five whiskers. The largest response was from the principal barrel and smallest from the barrel four distant. F: summed CSD-Sink activity for the long stimulus duration. This measure was taken from the sum of all deflections split into the first 4 s of stimulation and the last 4 s of stimulation (±SE). Note that magnitudes of these responses differ from the 2 s stimulation data in (6c) because the times series have been summed over 4 s rather than 2 s of data.
FIG. 7.
FIG. 7.
Neural and hemodynamic responses for long stimulation. Normalized neural and (a) Hbt, (b) Hbo2 and (c) Hbr responses plotted against one another for the first and last 4 s of stimulation. All the responses were non-linear in shape and fitted with a monotonic relationship defined by the equation Hx = c (Eb)p. For all cases there was a greater hemodynamic response in the first 4 s compared to the last 4 s for a proportional measure of neural activity (NA). Strongly suggesting the hemodynamic measurements taken for the last 4 s are more localized.

References

    1. Barth DS, Sutherling W. Current source-density and neuromagnetic analysis of the direct cortical response in rat cortex. Brain Res 450: 280–294, 1988. - PubMed
    1. Berwick J, Johnston D, Jones M, Martindale J, Redgrave P, McLoughlin N, Schiessl I, Mayhew JE. Neurovascular coupling investigated with two-dimensional optical imaging spectroscopy in rat whisker barrel cortex. Eur J Neurosci 22: 1655–1666, 2005a. - PubMed
    1. Berwick J, Jones M, Martindale J, Mayhew JEW. High resolution 2 dimensional optical imaging spectroscopy of single whisker representations in rat somatosensory cortex. Soc Neurosci Abstr 2005b.
    1. Blood AJ, Pouratian N, Toga AW. Temporally staggered forelimb stimulation modulates barrel cortex optical intrinsic signal responses to whisker stimulation. J Neurophysiol 88: 422–437, 2002. - PubMed
    1. Blood AJ, Toga AW. Optical intrinsic signal imaging responses are modulated in rodent somatosensory cortex during simultaneous whisker and forelimb stimulation. J Cereb Blood Flow Metab 18: 968–977, 1998. - PubMed

Publication types

LinkOut - more resources