Review
. 2007;8 Suppl 1(Suppl 1):S12.
doi: 10.1186/gb-2007-8-s1-s12.

Predicting preferential DNA vector insertion sites: implications for functional genomics and gene therapy

Affiliations
Review

Predicting preferential DNA vector insertion sites: implications for functional genomics and gene therapy

Christopher S Hackett et al. Genome Biol. 2007.

Abstract

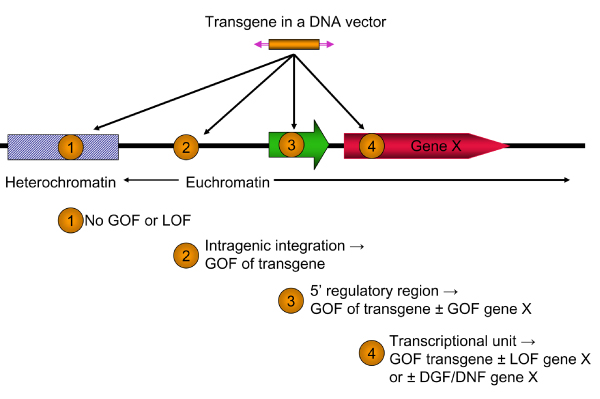
Viral and transposon vectors have been employed in gene therapy as well as functional genomics studies. However, the goals of gene therapy and functional genomics are entirely different; gene therapists hope to avoid altering endogenous gene expression (especially the activation of oncogenes), whereas geneticists do want to alter expression of chromosomal genes. The odds of either outcome depend on a vector's preference to integrate into genes or control regions, and these preferences vary between vectors. Here we discuss the relative strengths of DNA vectors over viral vectors, and review methods to overcome barriers to delivery inherent to DNA vectors. We also review the tendencies of several classes of retroviral and transposon vectors to target DNA sequences, genes, and genetic elements with respect to the balance between insertion preferences and oncogenic selection. Theoretically, knowing the variables that affect integration for various vectors will allow researchers to choose the vector with the most utility for their specific purposes. The three principle benefits from elucidating factors that affect preferences in integration are as follows: in gene therapy, it allows assessment of the overall risks for activating an oncogene or inactivating a tumor suppressor gene that could lead to severe adverse effects years after treatment; in genomic studies, it allows one to discern random from selected integration events; and in gene therapy as well as functional genomics, it facilitates design of vectors that are better targeted to specific sequences, which would be a significant advance in the art of transgenesis.


Figures

Figure 1
Figure 1
Potential genetic consequences of integration of transgenic cassettes into chromatin. An expression cassette (orange box) in a viral or nonviral vector (represented by purple inverted arrowheads, which indicate either inverted or direct terminal repeats) can integrate into four classes of chromatin. (1) Integration into heterochromatin will most likely result in the suppression of expression of the transgene and essentially no genetic consequences for the host. (2) Integration into intergenic regions of euchromatin is the most desirable outcome; the transgenic cassette is expressed, leading to a gain of function (GOF) in the host cell. (3) Integration into a transcriptional regulatory region can have several outcomes including expression (GOF) of the transgenic cassette, potentially modified by neighboring enhancer and silencer elements in the region. Regulatory elements in the transgenic cassette may either enhance expression of the neighboring gene (GOF for gene X) or, in rare cases, block expression of an active gene. (4) Integration of the vector into a transcriptional unit may allow expression of the transgene but block expression of the host gene leading to a phenotypic loss of function (LOF). Integration within some genes can also lead to a dominant gain of function (DGF) or production of a dominant-negative form (DNF) of the original gene X. A further discussion of effects of insertional mutagenesis can be found in the reports by Carlson and Largaespada [61] and Collier and Largaespada [154].
Figure 2
Figure 2
Deviations of DNA structure from the average B-form DNA that play a role modeling three-dimensional structures of specific DNA sequences. The figure illustrates physical parameters of B-form DNA structure that are altered in preferred sites for integration of insertional vectors. (a) B-form DNA. (b) A-DNA. Interactions between neighboring nucleotides govern the variable energy needed to convert from B-DNA to A-DNA. The propensity of a sequence of B-form DNA to adopt the A-form is referred to as A-philicity [134]. (c) Parameters of base pair orientation affected by protein-DNA binding. 'Twist' (horizontal looping arrow) refers to the rotation of base pairs around a central axis (heavy vertical black line); the average rotation between two base pairs is 36°. 'Tilt' (dotted lines) refers to the inclination of the base pairs with respect to the central axis; the average tilt is 0° between base pairs, which are normally parallel in B-form DNA. 'Rise' (vertical double arrowhead) is the distance between adjacent base pairs; the normal spacing is slightly more than 3.3 Å, but it can be more than 3.4 Å at preferred target sites. 'Slide' (horizontal double arrowhead) refers to the shifting of the axis of a base pair out of alignment with the central axis. 'Roll' (vertical looping arrow) refers to rotation of the nucleotide plane around a horizontal axis. A given base pair may be distorted in more than one of these parameters. Vstep analysis is a method of examining these, and other physical parameters such as 'shift', in terms of a single number that derives from the transition from one base pair to another [131,137]. (d) DNA bendability
Figure 3
Figure 3
Approaches to identification of DNA structural characteristics governing insertion site preferences for Tol2 and SB transposons. (a) Averaging of all available insertion sites smoothes trends observed in individual plots. Plot of Vstep profiles of 18 20-base-pair Tol2 insertions (left, from Balciunas and coworkers [89]) compared with 18 randomly generated sequences (right). Averages are shown by thick black lines. Although individual Tol2 profiles appear jagged, peaks are not position specific, and so the plot of the average of 36 sites reveals only one small, distinct peak. Individual random sequences also appear jagged, but an average of over 9,000 random sequences is a flat line. (b) Analyses of Tol2 insertion site A-philicity profiles, compared with 18 random sequences. Trends are similar to Vstep patterns. (c) Plot of trinucleotide bendability for Tol2 and random sites, indicating only small common trends compared with random sequence. The random sequences in panels a to c were acquired from a 10 megabase portion of human chromosome 1p. (d) Bendability plots for Sleeping Beauty (SB) insertion sites (from Yant and coworkers [106]). The average trinucleotide bendability at each position of 12-base insertion sites is shown for 574 insertions ('all sites'), as well as a subset of 189 insertions classified as 'preferred' based on Vstep profiles ('preferred sites'). Random TA sites are shown in green, and random sites in black. This plot shows how identification of 'preferred' sites can be useful in distinguishing structural patterns for common insertion sites; preferred sites (based on common patterns of protein-induced deformability in recurrently hit sites) exhibit an overall increase in a separate parameter, DNA bendability, when 'basal' sites are removed.
Figure 4
Figure 4
Variability in DNA structural characteristics between insertion sites for various vectors. All (a) A-philicity, (b) trinucleotide bendability, and (c) Vstep values were summed across 12 nucleotides and averaged for all sites of each vector class. (d) 'Jaggedness' was measured by taking the absolute value of differences between adjacent Vstep values, which were then summed and averaged, as in panels a to c. Error bars represent standard deviations. 'SB' indicates 574 Sleeping Beauty integrations into human cells identified by Yant and coworkers [106]. 'SB preferred' indicates a subset of 189 sites from the Yant dataset classified as 'preferred' by ProTIS [116]. 'tol2' indicates 63 Tol2 integrations [89]. 'piggyBac' indicates 297 piggyBac insertions deposited into Genbank by Exelexis containing a single TTAA sequence flanked by 10 bases on each side. 'P-element' indicates 920 P-element insertion sites mapped by Liao and coworkers [130]. 'ASV' indicates 357 avian sarcoma leukosis virus (ASLV) insertions into 293T-TVA cells. 'HIV' indicates 334 HIV integrations into SubT1 cells. 'MLV' indicates 695 murine leukemia virus integrations into HeLa cells. 'SIV' indicates 148 simian immunodeficiency virus integrations into CEMx164 cells. All P-element, ASV, HIV, MLV, and SIV sequences were kindly provided by Dr Xioalin Wu. All sites were compared with three sets of over 9,000 randomly selected 12-mers from 10 megabase sections of human chromosome 1 (Hs), mouse chromosome 4 (Mm), and Drosophila chromosome 3L (Dm), and 10,000 randomly selected TA and TTAA sites from human chromosome 1.
Figure 5
Figure 5
Insertion prediction for transposon vectors surrounding the c-myc locus on mouse chromosome 15. A 3 kilobase sequence from the mouse c-myc locus (from 61,813,400 to 61,816,400 base pairs) harboring 37 retroviral insertions submitted to the Mouse Retrovirus Tagged Cancer Gene Database [155] is shown. The first exon and intron of c-myc are shown in orange; the upstream promoter sequence is shaded in yellow. (a) Retrovirus insertion frequency per 50 base pair (bp) segment. Panels (b) to (g) show DNA structural characteristics at 50 bp resolution. (b) Total Vstep for each bin across the region. (c) Total Vstep jaggedness. (d) Total A-philicity values. (e) Total trinucleotide bendability. (f) Number of TTAA sequences per 50 bp bin, representing the total number of possible piggyBac insertion sites. Notably, many regions harboring oncogene-selected retroviral insertions have few or no TTAA sequences, suggesting that the likelihood of a piggyBac insertion causing an oncogenic event may be lower than that for retroviruses. Arrow represents a potential 'hotspot' for integration, over 1 kilobase upstream of exon 1. (g) ProTIS prediction shows a similar, low incidence of preferred SB integration sites. Arrow indicates predicted hotspot for integration over 1 kilobase upstream of exon 1, and slightly upstream of the TTAA hotspot. SB, Sleeping Beauty.
Figure 6
Figure 6
SB insertions across the mouse Braf gene. Thirty Sleeping Beauty (SB) insertions deposited in the Retroviral-Tagged Cancer Gene Database were mapped across the entire Braf transcript and 10 kilobases upstream (NCBI 36 build; note that Braf is transcribed right-to-left). Most oncogenic insertions occurred in introns 11 and 12 (formerly annotated as intron 9). (a) ProTIS profiling across the entire gene reveals predicted hotspots for SB integration, but (b) most actual integrations were found in a relatively low scoring region corresponding to introns 11 and 12. A blowup of this local 4.9 kilobase region demonstrates that (c) ProTIS scores closely match (d) patterns of actual transposon integration. bp, base pairs

References

    1. Zambrowicz BP, Friedrich GA, Buxton EC, Lilleberg SL, Person C, Sands SL. Disruption and sequence identification of 2,000 genes in mouse embryonic stem cells. Nature. 1998;392:608–611. doi: 10.1038/33423. - DOI - PubMed
    1. Mitchell KJ, Pinson KI, Kelly OG, Brennan J, Zupicich J, Scherz P, Leighton PA, Goodrich LV, Lu X, Avery BJ, et al. Functional analysis of secreted and transmembrane proteins critical to mouse development. Nat Genet. 2001;28:198–200. doi: 10.1038/90074. - DOI - PubMed
    1. Mikkers H, Berns A. Retroviral insertional mutagenesis: tagging cancer pathways. Adv Cancer Res. 2003;88:53–99. - PubMed
    1. Edelstein ML, Abedi MR, Wixon J, Edelstein RM. Gene therapy clinical trials worldwide 1989-2004-an overview. Gene Med. 2004;6:597–602. doi: 10.1002/jgm.619. - DOI - PubMed
    1. Sinn PL, Sauter SL, McCray PB., Jr Gene therapy progress and prospects: Development of improved lentiviral and retroviral vectors: design, biosafety, and production. Gene Ther. 2005;12:1089–1098. doi: 10.1038/sj.gt.3302570. - DOI - PubMed

Publication types