. 2007 Nov 1;8 Suppl 7(Suppl 7):S18.
doi: 10.1186/1471-2105-8-S7-S18.

SVM clustering

Affiliations

SVM clustering

Stephen Winters-Hilt et al. BMC Bioinformatics. .

Abstract

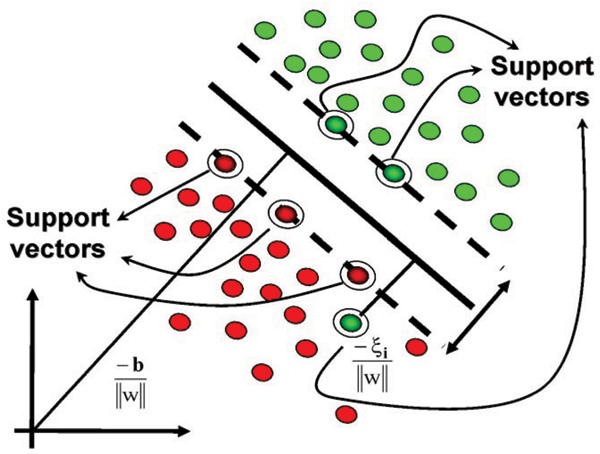
Background: Support Vector Machines (SVMs) provide a powerful method for classification (supervised learning). Use of SVMs for clustering (unsupervised learning) is now being considered in a number of different ways.

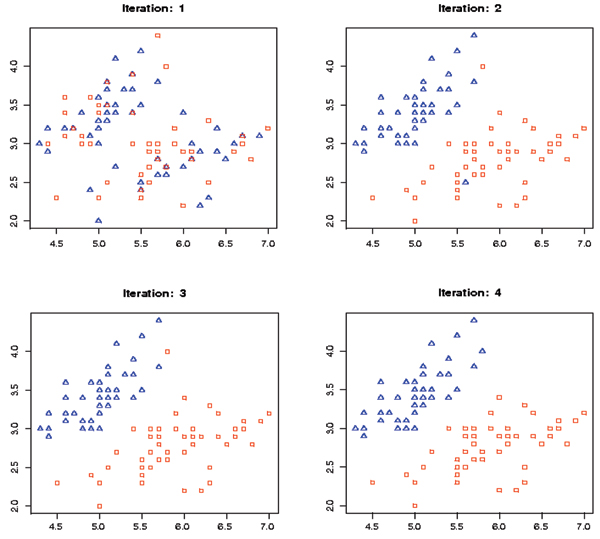
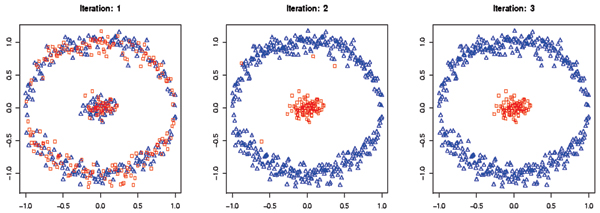
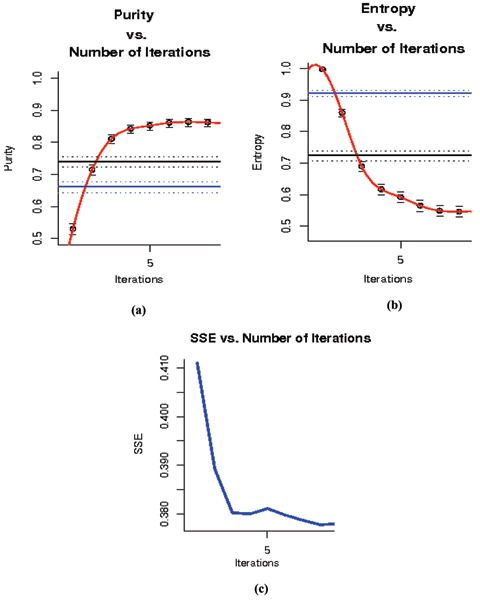
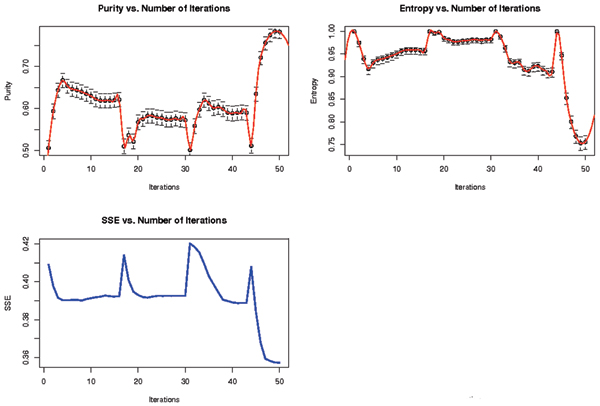
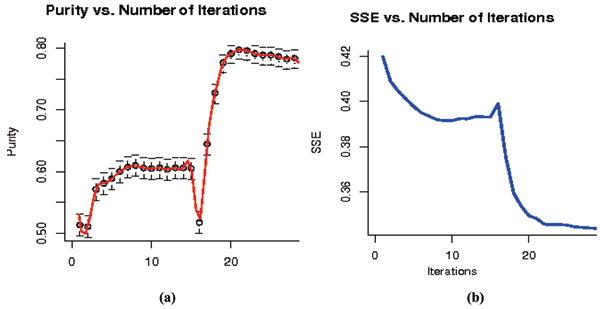
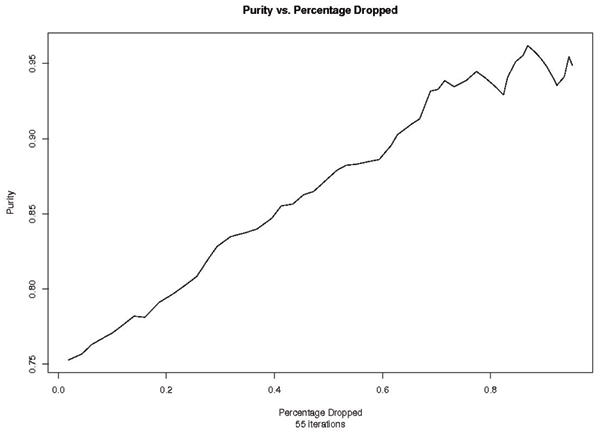
Results: An SVM-based clustering algorithm is introduced that clusters data with no a priori knowledge of input classes. The algorithm initializes by first running a binary SVM classifier against a data set with each vector in the set randomly labelled, this is repeated until an initial convergence occurs. Once this initialization step is complete, the SVM confidence parameters for classification on each of the training instances can be accessed. The lowest confidence data (e.g., the worst of the mislabelled data) then has its' labels switched to the other class label. The SVM is then re-run on the data set (with partly re-labelled data) and is guaranteed to converge in this situation since it converged previously, and now it has fewer data points to carry with mislabelling penalties. This approach appears to limit exposure to the local minima traps that can occur with other approaches. Thus, the algorithm then improves on its weakly convergent result by SVM re-training after each re-labeling on the worst of the misclassified vectors - i.e., those feature vectors with confidence factor values beyond some threshold. The repetition of the above process improves the accuracy, here a measure of separability, until there are no misclassifications. Variations on this type of clustering approach are shown.

Conclusion: Non-parametric SVM-based clustering methods may allow for much improved performance over parametric approaches, particularly if they can be designed to inherit the strengths of their supervised SVM counterparts.


Figures

Figure 1
Figure 1
Support Vector Machine uses Structural Risk Minimization to compare various separation models and to eventually choose the model with the largest margin of separation.
Figure 2
Figure 2
The choice of kernel along with a genuine set of kernel parameters is important as the above table summarizes some of the most popular kernels used for classification and clustering.
Figure 3
Figure 3
The results of SVM-Relabeler algorithm using the linear kernel.
Figure 4
Figure 4
The results of SVM-Relabeler algorithm using a third degree polynomial kernel.
Figure 5
Figure 5
(a) and (b) show the boost in Purity and Entropy as a function of Number of Iterations after the completion the completion of the Re-labeler algorithm. (c) demonstrates SSE as an unsupervised evaluation mechanism that mimics purity and entropy as the measure of true clusters. The blue and black lines are the result of running fuzzy c-mean and kernel k-mean on the same dataset.
Figure 6
Figure 6
The result of Re-labeler Algorithm with Perturbation. The top plots demonstrate the various Purity and Entropy scores for each perturbed run. The spikes are drops followed by recovery in the validity of the clusters as a result of random perturbation. The bottom plot is a similar demonstration, by tracking the unsupervised quality of the clusters. Note that after 4 runs of perturbation best solution is recovered.
Figure 7
Figure 7
(a) and (b) represent the SSE and Purity evaluation of hybrid Re-labeler with Perturbation on the same dataset. Data is initially clustered using k-means to initialize the Re-labeler algorithm. The first segment of the plot (right before the spike at 16) is the result of Re-labeler after 10% perturbation, while the second segment is the result after 30% perturbation. Purity Number of Iterations.
Figure 8
Figure 8
Purity vs Percentage Dropped after 55 iterations. At about 78% drop the data set becomes too small and the statistics begin to have much greater variance.

References

    1. Ratsch G, Tsuda K, Muller K, Mika S, Schölkopf B. An introduction to kernel-based learning algorithms. IEEE Trans Neural Netw. 2001;12:181–201. doi: 10.1109/72.914517. - DOI - PubMed
    1. Winters-Hilt S, Yelundur A, McChesney C, Landry M. Support Vector Machine Implementations for Classification & Clustering. BMC Bioinformatics. 2006;7:S4. doi: 10.1186/1471-2105-7-S2-S4. - DOI - PMC - PubMed
    1. Vapnik VN. The Nature of Statistical Learning Theory. 2. Springer-Verlag, New York; 1998.
    1. Burges CJC. A tutorial on support vector machines for pattern recognition. Data Min Knowl Discov. 1998;2:121–67. doi: 10.1023/A:1009715923555. - DOI
    1. Kumar V, Tan P, Steinbach M. Introduction to data mining. Pearson Education, Inc; 2006.

Publication types

LinkOut - more resources