. 2007 Nov 1;8 Suppl 7(Suppl 7):S2.
doi: 10.1186/1471-2105-8-S7-S2.

Systems biology approach for mapping the response of human urothelial cells to infection by Enterococcus faecalis

Affiliations

Systems biology approach for mapping the response of human urothelial cells to infection by Enterococcus faecalis

Mikhail G Dozmorov et al. BMC Bioinformatics. .

Abstract

Background: To better understand the response of urinary epithelial (urothelial) cells to Enterococcus faecalis, a uropathogen that exhibits resistance to multiple antibiotics, a genome-wide scan of gene expression was obtained as a time series from urothelial cells growing as a layered 3-dimensional culture similar to normal urothelium. We herein describe a novel means of analysis that is based on deconvolution of gene variability into technical and biological components.

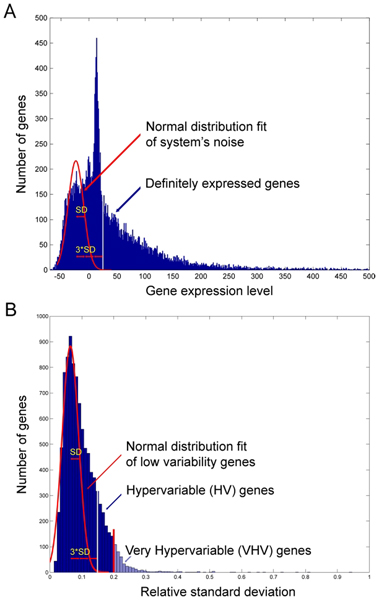
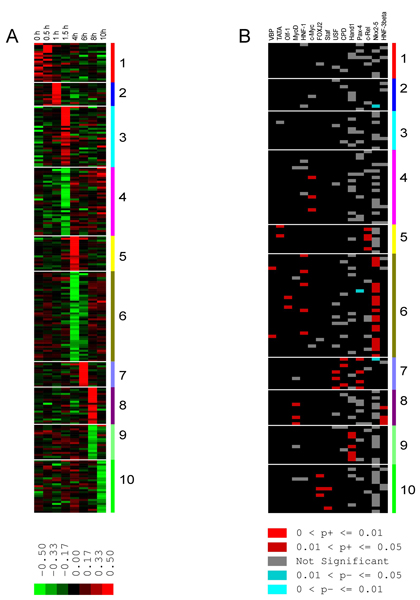
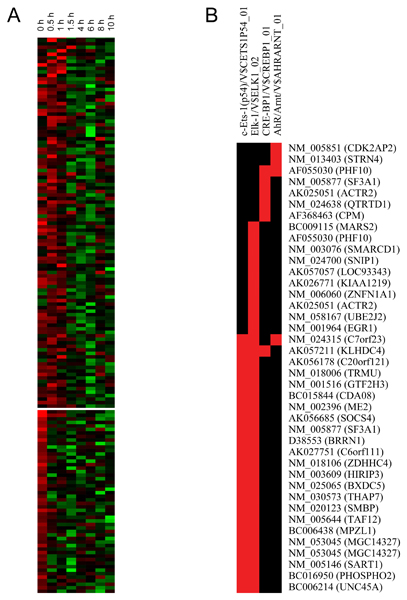
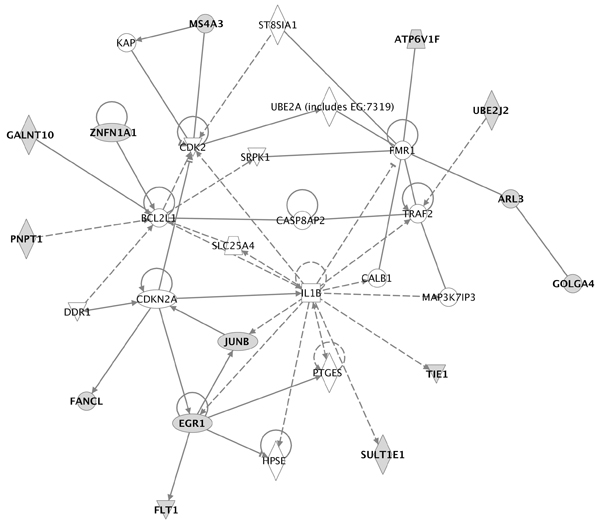
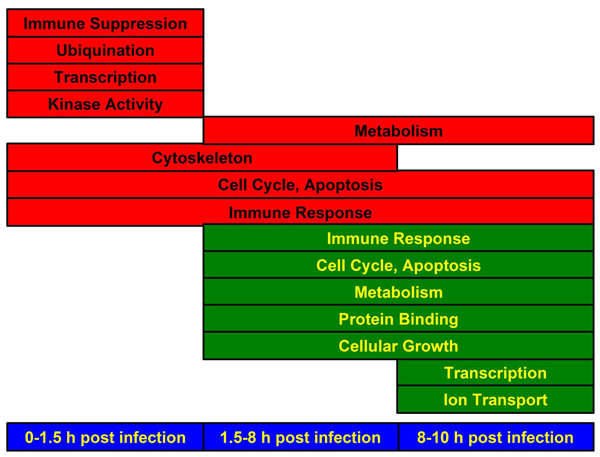
Results: Analysis of the expression of 21,521 genes from 30 minutes to 10 hours post infection, showed 9553 genes were expressed 3 standard deviations (SD) above the system zero-point noise in at least 1 time point. The asymmetric distribution of relative variances of the expressed genes was deconvoluted into technical variation (with a 6.5% relative SD) and biological variation components (>3 SD above the mode technical variability). These 1409 hypervariable (HV) genes encapsulated the effect of infection on gene expression. Pathway analysis of the HV genes revealed an orchestrated response to infection in which early events included initiation of immune response, cytoskeletal rearrangement and cell signaling followed at the end by apoptosis and shutting down cell metabolism. The number of poorly annotated genes in the earliest time points suggests heretofore unknown processes likely also are involved.

Conclusion: Enterococcus infection produced an orchestrated response by the host cells involving several pathways and transcription factors that potentially drive these pathways. The early time points potentially identify novel targets for enhancing the host response. These approaches combine rigorous statistical principles with a biological context and are readily applied by biologists.


Figures

Figure 1
Figure 1
Histogram of relative standard deviation distribution of 9,553 expressed genes. The normal distribution of low-variable genes determined from the left portion of the histogram is superimposed on the actual histogram. SD – standard deviation for the normal distribution, 3*SD (white vertical line) – cut-off level for HV genes, red vertical line – cut-off for VHV genes with relative SD ≥ 0.2.
Figure 2
Figure 2
K-means and PAINT clustering of VHV genes over the time course of infection. A) Map of up- and down-regulated gene clusters assembled from 239 VHV genes. Red/Green mark increase/decrease in relative gene expression level referenced to the median of the gene over time, respectively. B) Common TREs for given clusters. Color bars at right represent different gene clusters. Red indicates genes sharing overrepresented (p < 0.05) TREs, grey/blue mark genes with not significantly overrepresented/underrepresented TREs, respectively. A larger version complete with gene names is provided in the Additional file 3. A schematic diagram of the significant functions identified by IPA can be found in Figure 5.
Figure 3
Figure 3
K-means and PAINT clustering in expanded early response HV genes. A) K-means clustering of 140 and 52 genes upregulated early and dropped afterwards. B) Common TREs for those genes, filtered by p < 0.05 and FDR < 0.3.
Figure 4
Figure 4
Example of first plausible network of genes in enhanced cluster 1. All other networks of interacting genes in this and other clusters are listed in the Additional files 4, 5, 6, 7, 8, 9, 10, 11, 12, 13, 14, 15, 16.
Figure 5
Figure 5
Schematic diagram of significant functions identified by IPA analysis of clusters shown in Fig. 2. Functions associated with genes that were up-regulated are shown in red and those that were down-regulated are shown in green.

References

    1. Mans JJ, Lamont RJ, Handfield M. Microarray analysis of human epithelial cell responses to bacterial interaction. Infect Disord Drug Targets. 2006;6:299–309. - PubMed
    1. Kamysz W. Are antimicrobial peptides an alternative for conventional antibiotics? Nucl Med Rev Cent East Eur. 2005;8:78–86. - PubMed
    1. Finlay BB, Cossart P. Exploitation of mammalian host cell functions by bacterial pathogens. Science. 1997;276:718–725. doi: 10.1126/science.276.5313.718. - DOI - PubMed
    1. Parsons CL, Greenspan C, Moore SW, Mulholland SG. Role of surface mucin in primary antibacterial defense of bladder. Urology. 1977;9:48–52. doi: 10.1016/0090-4295(77)90284-9. - DOI - PubMed
    1. Uehling DT, Johnson DB, Hopkins WJ. The urinary tract response to entry of pathogens. World J Urol. 1999;17:351–358. doi: 10.1007/s003450050160. - DOI - PubMed

Publication types