Comparative Study
. 2008 Feb 22;275(1633):369-76.
doi: 10.1098/rspb.2007.1391.

Filling the gap between identified neuroblasts and neurons in crustaceans adds new support for Tetraconata

Affiliations
Comparative Study

Filling the gap between identified neuroblasts and neurons in crustaceans adds new support for Tetraconata

Petra Ungerer et al. Proc Biol Sci. .

Abstract

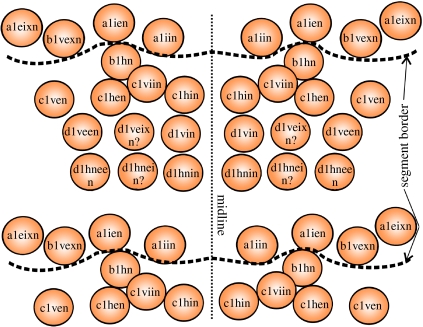
The complex spatio-temporal patterns of development and anatomy of nervous systems play a key role in our understanding of arthropod evolution. However, the degree of resolution of neural processes is not always detailed enough to claim homology between arthropod groups. One example is neural precursors and their progeny in crustaceans and insects. Pioneer neurons of crustaceans and insects show some similarities that indicate homology. In contrast, the differentiation of insect and crustacean neuroblasts (NBs) shows profound differences and their homology is controversial. For Drosophila and grasshoppers, the complete lineage of several NBs up to formation of pioneer neurons is known. Apart from data on median NBs no comparable results exist for Crustacea. Accordingly, it is not clear where the crustacean pioneer neurons come from and whether there are NBs lateral to the midline homologous to those of insects. To fill this gap, individual NBs in the ventral neuroectoderm of the crustacean Orchestia cavimana were labelled in vivo with a fluorescent dye. A partial neuroblast map was established and for the first time lineages from individual NBs to identified pioneer neurons were established in a crustacean. Our data strongly suggest homology of NBs and their lineages, providing further evidence for a close insect-crustacean relationship.


Figures

Figure 1
Figure 1
Modes of neurogenesis in euarthropods. In chelicerates and myriapods, neurons are generated via immigration of post-mitotic neural precursor cells (np), whereas in insects and crustaceans we find specialized cells, NBs, which divide in a stem cell-like manner. In insects, they bud off smaller GMCs which subsequently divide only once to generate GCs that differentiate into neurons and glia cells. There are indications for such a division pattern in higher crustaceans, but direct evidence is still missing. e, ectoderm.
Figure 2
Figure 2
Invariant cell lineages in the ventral ectoderm in O. cavimana. (a) Scheme (modified after Wolff & Scholtz 2006) of the cell division pattern in the post-naupliar ectoderm characteristic for malacostracan crustaceans. The designation of the cells arising within the stereotyped cell division pattern in the post-naupliar germ band of O. cavimana follows Scholtz (1990). Each of the transverse ectodermal rows (row abcd) which form at a stage of approximately 400 cells represents a genealogical unit and undergoes the same division pattern. First, it undergoes two mitotic waves with longitudinal spindle directions resulting in a grid-like pattern of four rows (a, b, c, d). With the subsequent differential cleavages, morphogenesis starts. Within the cell columns 0 (midline) to 2, the ganglion anlagen are formed, whereas the more lateral columns give rise to the limb anlagen (orange line marks border between ganglion anlagen and limb anlagen). b1hn and d1hn (marked in red) represent the first NBs arising from the stereotyped cell divisions of the initial ectodermal rows. During each differential cleavage, new NBs are added, the NBs themselves being able to switch to the production of ectodermal cells and back to the production of GMCs. The segmental border does not match the genealogical border. The segmental border runs between the descendants of row b (black dotted line). The present study focuses on the cells of column 1 which were labelled mainly after the second mitotic wave (a1, b1, c1 and d1). After the differential cleavages, labelling is hindered by the small size of the cells. (b) Detail of two thoracic segments during the differential cleavages (SEM image). The midline (0) and cell columns 1 and 2 which give rise to the ventral ganglia are marked in orange. The first two NBs arising during the differential cleavages in cell column 1 are marked in red (b1hn and d1hn).
Figure 3
Figure 3
Neuroblast map of a generalized thoracic segment in Orchestia. From the cells of column 1 of the grid-like pattern in the post-naupliar ectoderm of Orchestia, 13–15 NBs arise.
Figure 4
Figure 4
Early neuroblast divisions in the thoracic segments of Orchestia. Anterior is to the top and median to the right. (a) DiI labelling of the cell d1v (red) with nucleic specific Hoechst counterstain (blue); stage 2 (staging according to Ungerer & Wolff 2005). Three-dimensional reconstruction (posteroventral view on the ganglion anlagen) with Imaris (Surpass mode). To better visualize labelled cells, their nuclei are marked with orange balls. The NBs d1vin and d1veen arise from the cell d1v and produce smaller GMCs (asterisks) into the interior of the ganglion anlage. It is very probable that d1vei or one of its descendants (d1veixn) represents a neuroblast, although the assignment of GMCs was not always possible without doubt due to the close spatial relation of cells. (b) DiI labelling of a1 in stage 3 of Orchestia development. Digital frontal section through the ganglion anlage (Imaris) showing the three NBs in the a1 lineage and their descendants which enter dorsomedially into the ganglion anlage. (c) Same labelling and CLSM image stack as in (b) with three-dimensional visualization of cells by setting a ball in each cell in Imaris. White arrows point to the border of GMCs (asterisks) and GCs. After three GMCs have been produced, the first starts to divide resulting in two GCs. Again, after three divisions of GMCs, the first GCs start to differentiate into neurons (black arrow points to first axon of the neuroblast alien) or glia cells (not shown).
Figure 5
Figure 5
Comparison of b1hn in Orchestia and 1–1 in insects. (a) Neuroblast map of thoracic segment in Orchestia, b1hn is marked red. d1hnin (yellow) and a1iin (light grey) are NBs which also have putatively homologous counterparts in insects. Grey-shaded NBs are engrailed positive (according to Scholtz et al. 1993). (b) DiI labelling of b1 (excited with blue light instead of green light to avoid early bleaching). After the second mitotic wave, one of the first NBs appears in the descendants of the cell column 1, b1hn. Anterior is to the top. (c) Clone of b1 in stage 3 of Orchestia. Anterior is to the top, median to the right. The first GMC of the neuroblast b1hn migrates medially and the resulting GCs are the first to differentiate. (d) Clone of b1 in stage 3–4 of Orchestia. Anterior is to the top, median to the left. The first GMCs of the neuroblast b1hn have migrated into the anteriorly adjacent ganglion anlage and the early outgrowing axon of pCC is visible. (e,f) Clone of b1 at late stage 4 of Orchestia, dorsal view. (e) Schematic reconstruction. (f) Imaris Surpass mode. The clone of b1 contributes cells to two adjacent ganglia. The sibling neurons aCC and pCC lie in the dorsalmost layer of the ganglion in the angle between posterior commissure (pc) and connective. aCC is a motoneuron leaving the CNS via the intersegmental nerve whereas pCC is an interneuron sending an axon anteriorly along the ipsilateral connective. Black asterisks in the scheme mark clusters of not individually identified neurons and/or glia cells with their axons being marked in green. Dotted line represents segment border. (g) Drosophila neuroblast map (modified after Doe 1992). The neuroblast 1–1 is marked red; 4–2 (yellow) and 7–1 (light grey) are NBs which also have putatively homologous counterparts in Orchestia. Grey-shaded NBs are engrailed positive. Dotted line represents segment border. (h) Clone of 1–1 (after Bossing et al. 1996). The progeny of 1–1 is distributed between two adjacent ganglia, as is the clone of b1hn. The sibling neurons aCC and pCC also lie in the dorsalmost layer of the ganglion in the angle between pc and connective.
Figure 6
Figure 6
Comparison of Orchestia and Drosophila NBs. (a) Clone of d1 (red) in a thoracic ganglion counterstained with Hoechst (blue; Imaris, Surpass mode). The clone of d1 comprises among others the lineage of d1hnin, the first GMC of which produces a neuron corresponding in position and axon morphology the RP2 neuron of Drosophila (figure 6b). It lies in the dorsalmost layer of the CNS between ac and pc (white star) and sends an axon anteriorly in the connective and into the intersegmental nerve (white arrowheads). (b) Neuroblast 4–2 of Drosophila (after Bossing et al. 1996). The motoneuron RP2 lies in the dorsalmost layer of the ganglion and sends an axon into the intersegmental nerve (red open arrowheads). (c) Clone of a1 (red) in a thoracic ganglion (Imaris, Surpass mode). The posterior- and medianmost neurons of the clone of a1 (white star) are produced by the neuroblast a1iin (see also figure 4c). They are large neurons lying in a dorsal layer of the CNS with putatively homologous axon pathways as the U motoneurons in Drosophila (figure 6d) into the ipsilateral intersegmental nerve. (d) Neuroblast 7–1 of Drosophila (after Bossing et al. 1996). The U neurons are large motoneurons occupying a position ventromedial to the aCC and pCC neurons (figure 5h) sending their axons into the ipsilateral intersegmental nerve.

References

    1. Bate C.M. Embryogenesis of an insect nervous system I. A map of the thoracic and abdominal neuroblasts in Locusta migratoria. J. Embryol. Exp. Morphol. 1976;35:107–123. - PubMed
    1. Boore J.L, Lavrov D.V, Brown W.M. Gene translocation links insects and crustaceans. Nature. 1998;392:667–668. doi:10.1038/33577 - DOI - PubMed
    1. Bossing T, Udolph G, Doe C.Q, Technau G.M. The embryonic central nervous system lineages of Drosophila melanogaster. I. Neuroblast lineages derived from the ventral half of the neurectoderm. Dev. Biol. 1996;179:41–64. doi:10.1006/dbio.1996.0240 - DOI - PubMed
    1. Broadus J, Doe C.Q. Evolution of neuroblast identity: seven-up and prospero expression reveal homologous and divergent neuroblast fates in Drosophila and Schistocerca. Development. 1995;121:3989–3996. - PubMed
    1. Broadus J, Skeath J.B, Spana E.P, Bossing T, Technau G.M, Doe C.Q. New neuroblast markers and the origin of the aCC/pCC neurons in the Drosophila central nervous system. Mech. Dev. 1995;53:393–402. doi:10.1016/0925-4773(95)00454-8 - DOI - PubMed

Publication types