. 2008 Mar 1;111(5):2685-92.
doi: 10.1182/blood-2006-12-062265. Epub 2007 Nov 29.

ZAP-70 enhances IgM signaling independent of its kinase activity in chronic lymphocytic leukemia

Affiliations

ZAP-70 enhances IgM signaling independent of its kinase activity in chronic lymphocytic leukemia

Liguang Chen et al. Blood. .

Abstract

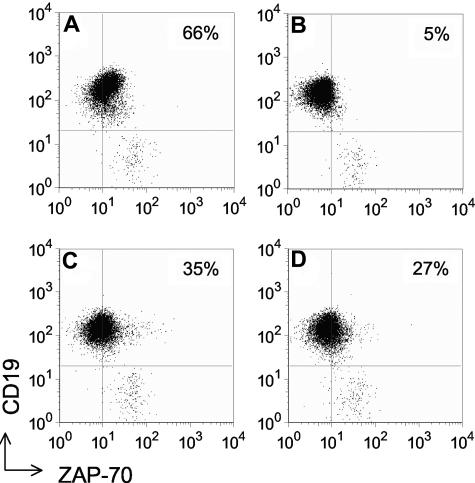
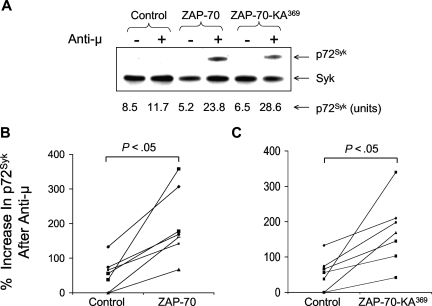
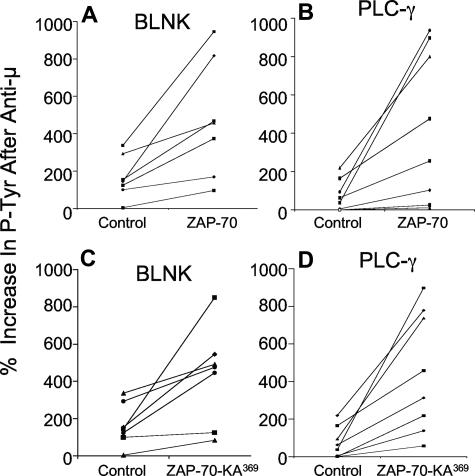
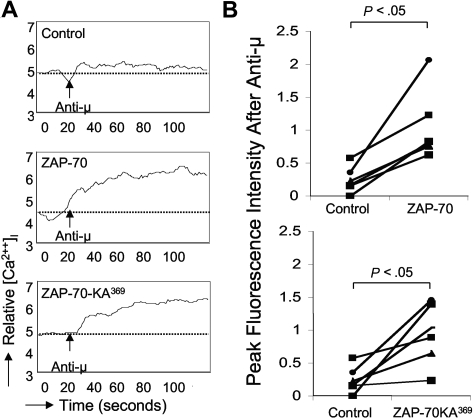
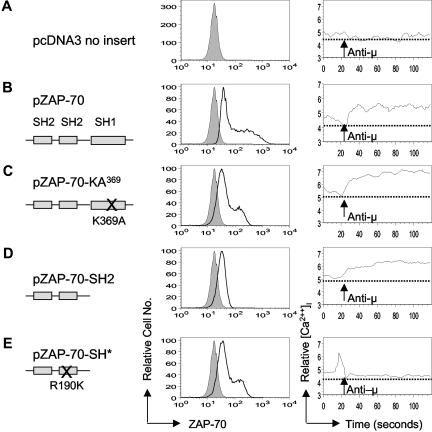
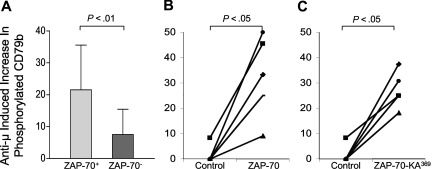
We transduced chronic lymphocytic leukemia (CLL) cells lacking ZAP-70 with vectors encoding ZAP-70 or various mutant forms of ZAP-70 and monitored the response of transduced CLL cells to treatment with F(ab)(2) anti-IgM (anti-mu). CLL cells made to express ZAP-70, a kinase-defective ZAP-70 (ZAP-70-KA(369)), or a ZAP-70 unable to bind c-Cbl (ZAP-YF(292)) experienced greater intracellular calcium flux and had greater increases in the levels of phosphorylated p72(Syk), B-cell linker protein (BLNK), and phospholipase C-gamma, and greater activation of the Ig accessory molecule CD79b in response to treatment with anti-mu than did mock-transfected CLL cells lacking ZAP-70. Transfection of CLL cells with vectors encoding truncated forms of ZAP-70 revealed that the SH2 domain, but not the SH1 domain, was necessary to enhance intracellular calcium flux in response to treatment with anti-mu. We conclude that ZAP-70 most likely acts as an adapter protein that facilitates B-cell receptor (BCR) signaling in CLL cells independent of its tyrosine kinase activity or its ability to interact with c-Cbl.


Figures

Figure 1
Figure 1
Detection of ZAP-70 in ZAP-70 CLL following transduction with Ad-ZAP-70 or Ad-ZAP-70-KA369. Dot plots depicting the log fluorescence of blood lymphocytes stained with Alexa-488–conjugated anti–ZAP-70 (x-axis) and PE-conjugated anti-CD19 (y-axis). The horizontal line depicts the threshold fluorescence exceeded by CD19+ CLL B cells, whereas the vertical line indicates the threshold fluorescence exceeded by cells scored as ZAP-70+, using a defined gating strategy, as described. The number provided in the top right-hand corner of each panel provides the percentage of the CD19+ CLL B cells with fluorescence exceeding the ZAP-70 threshold. CLL cell samples that have more than 20% ZAP-70+ cells are scored as being ZAP-70+. (A) ZAP-70+ CLL cell sample. (B) a ZAP-70 CLL cell sample transduced with a control adenovirus vector. (C) The same CLL sample as in panel B transduced with Ad-ZAP-70. (D) The same CLL sample as in panel B transduced with Ad-ZAP-70-KA369.
Figure 2
Figure 2
Increases in phosphorylated p72Syk induced by anti-μ in ZAP-70 CLL transduced with Ad-ZAP-70 or Ad-ZAP-70-KA369. (A) Comparison of CBA assay with immunoblot analysis to detect phosphorylated p72Syk. Phosphorylated p72Syk was determined by immunoblot analysis and CBA assay for ZAP-70 CLL transduced with Ad-ZAP-70 or Ad-ZAP-70-KA369. The band intensity for the anti-μ–stimulated CLL samples transfected with wild-type ZAP-70 was similar to that noted for the anti-μ–stimulated samples transfected with ZAP-70-KA369, providing a ratio of signal intensity that was similar to that using the CBA assay. The immunoblot results are a representative one of 3 experiments. (B,C) Percentage increase in phosphorylated p72Syk induced by treatment with anti-μ, as indicated on the y-axis of each panel. Each symbol represents the percentage increase in phosphorylated protein detected in an individual CLL cell sample. The lines connect the percentage increase in detected phosphorylated protein of anti-μ–treated CLL cell samples transduced with Ad-lacZ (“Control” in each panel) versus that measured in the same CLL cells that had been transduced with Ad-ZAP-70 (B) or Ad-ZAP-70-KA369 (C). The mean anti-μ–induced increase in each phosphoprotein detected in the Ad-ZAP-70– or Ad-ZAP-70-KA369–transduced CLL cells was significantly greater than that noted for the same phosphoprotein in the Ad-lacZ–transduced CLL cells following treatment with anti-μ (P < .05), which was not significantly different from that of anti-μ–treated mock-transfected CLL cells.
Figure 3
Figure 3
Increases in phosphorylated BLNK and PLC-γ induced by anti-μ in ZAP-70 CLL transduced with Ad-ZAP-70 or Ad-ZAP-70-KA369. The panels show the percentage increase in phosphorylated BLNK (A,C) and PLC-γ (B,D) induced by treatment with anti-μ, as indicated on the y-axis of each panel. Each symbol represents the percentage increase in phosphorylated protein detected in an individual CLL cell sample. The lines connect the percentage increase in detected phosphorylated protein of anti-μ–treated CLL cell samples transduced with Ad-lacZ (“Control” in each panel) versus that measured in the same CLL cells that had been transduced with Ad-ZAP-70 (A,B) or Ad-ZAP-70-KA369 (C,D). The mean anti-μ–induced increase in each phosphoprotein detected in the Ad-ZAP-70– or Ad-ZAP-70-KA369–transduced CLL cells was significantly greater than that noted for the same phosphoprotein in the Ad-lacZ–transduced CLL cells following treatment with anti-μ (P < .05), which was not significantly different from that of anti-μ–treated mock-transfected CLL cells.
Figure 4
Figure 4
IgM-induced calcium mobilization in ZAP-70 CLL B cells transduced with Ad-ZAP-70 or Ad-ZAP-70-KA369. (A) The fluorescence of labeled CLL cells induced by treatment with anti-μ is indicated on the y-axis over time (in seconds, as indicated on the x-axis). The horizontal dotted line in each panel provides the basal fluorescence of labeled cells prior to treatment. The arrow indicates the time when the cells were treated with anti-μ (IgM). The top panel shows the changes in calcium flux ([Ca2+]i) detected in ZAP-70 CLL cells transduced with Ad-lacZ (Control); the middle panel shows the [Ca2+]i observed in the same CLL sample transduced with Ad-ZAP-70; and the bottom panel shows the [Ca2+]i observed in the same CLL sample transduced with Ad-ZAP-70-KA369. (B) Peak increases in fluorescence intensity over the basal level in ZAP-70 CLL cells transduced with Ad-lacZ (Control) versus that of CLL cells transduced with Ad-ZAP-70 (top) or Ad-ZAP-70-KA369 (bottom). The lines connect the data points obtained from the same CLL sample, but transduced with Ad-lacZ (control) or Ad-ZAP-70 or Ad-ZAP-70-KA369, as indicated at the bottom of the panels.
Figure 5
Figure 5
Transduction of ZAP-70 CLL cells with Ad-ZAP-70 versus Ad-ZAP-70-YF292 and measurement of anti-μ–induced increases in phosphorylated p72Syk, BLNK, or PLC-γ. (A) Immunoblot ana-lysis for ZAP-70 (top row) in lysates of CLL cells before or after transduction with Ad-ZAP-70 or Ad-ZAP-70-YF,292 as indicated at the top of each lane. The blots were stripped and then reprobed with anti–β-actin to monitor for protein loading (bottom row), as indicated on the left of each blot. (B-D) Anti-μ–induced percentage increases in phosphorylated p72Syk (B), BLNK (C), or PLC-γ (D) detected in ZAP-70 CLL B cells that were transduced with the control vector or Ad-ZAP-70-YF292 (left panel) or with Ad-ZAP-70 or Ad-ZAP-70-YF292 (right panel). Each symbol represents the percentage increase in phosphorylated protein detected in an individual CLL cell sample. The lines connect the percentage increase in detected phosphorylated protein of anti-μ–treated CLL cells of the same sample transduced with each of the different vectors. The differences in the mean percentage increase of phosphorylated protein upon anti-μ treatment in control vector–transduced CLL cells versus that of Ad-ZAP-70-YF292–transduced CLL cells was significant (P < .05). However, there was not a significant difference in the mean percentage increase of phosphorylated protein upon anti-μ treatment of Ad-ZAP-70–transduced CLL cells versus that of Ad-ZAP-70-YF292–transduced CLL cells.
Figure 6
Figure 6
Transfection of ZAP-70 CLL cells with plasmid DNA encoding ZAP-70 or various mutant forms of ZAP-70. Left column shows schematics of ZAP-70 and each of the various ZAP-70 mutants used in these studies. Middle column shows the histogram depicting the autofluorescence of the control vector–transfected CLL cells (shaded histogram) and fluorescence of the cells stained for ZAP-70 (open histogram). Right column shows changes in calcium flux ([Ca2+]i) of each CLL sample that is observed upon treatment with anti-μ, as in Figure 4A. (A) CLL cells transfected with the empty control vector pcDNA3. (B) CLL cells transfected with pZAP-70. (C) CLL cells transfected with pZAP-70-KA369. (D) CLL cells transfected with pZAP-70-SH2. (E) CLL cells transfected with pZAP-70-SH*.
Figure 7
Figure 7
Anti-μ–induced increases in phosphorylated CD79b in ZAP-70+ versus ZAP-70 CLL cells or ZAP-70 CLL B cells made to express ZAP-70-Wt or ZAP-70-KA369. (A) Each bar represents the mean percentage increase in phosphorylated CD79b observed following treatment with anti-μ of CLL B cells that were ZAP-70+ (N = 28) or ZAP-70 (N = 19), as indicated at the bottom of the figure. The error bars indicate the standard deviation of the mean. The difference in the mean percentage increase in ZAP-70+ CLL cells versus ZAP-70 CLL cells was significant, as indicated by the P value at the top of the figure. (B,C) Anti-μ–induced increases in the level of phosphorylated CD79b detected in ZAP-70 CLL cells transduced with a control adenovirus or Ad-ZAP-70 (B), or control adenovirus or Ad-ZAP-70-KA369 (C). The lines connect the percentage increase in detected phosphorylated CD79b of anti-μ–treated CLL cell samples transduced with Ad-lacZ (“Control” in each panel) versus that measured in the same CLL cells that had been transduced with Ad-ZAP-70 (B) or Ad-ZAP-70-KA369 (C).

References

    1. Chan AC, Iwashima M, Turck CW, Weiss A. ZAP-70: a 70 kd protein-tyrosine kinase that associates with the TCR zeta chain. Cell. 1992;71:649–662. - PubMed
    1. Chan AC, Irving BA, Fraser JD, Weiss A. The zeta chain is associated with a tyrosine kinase and upon T-cell antigen receptor stimulation associates with ZAP-70, a 70-kDa tyrosine phosphoprotein. Proc Natl Acad Sci U S A. 1991;88:9166–9170. - PMC - PubMed
    1. Qian D, Weiss A. T cell antigen receptor signal transduction. Curr Opin Cell Biol. 1997;9:205–212. - PubMed
    1. Kane LP, Lin J, Weiss A. Signal transduction by the TCR for antigen. Curr Opin Immunol. 2000;12:242–249. - PubMed
    1. Chan AC, van Oers NS, Tran A, et al. Differential expression of ZAP-70 and Syk protein tyrosine kinases, and the role of this family of protein tyrosine kinases in TCR signaling. J Immunol. 1994;152:4758–4766. - PubMed

Publication types

MeSH terms