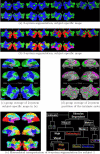
Detection of spatial activation patterns as unsupervised segmentation of fMRI data
- PMID: 18051050
- PMCID: PMC4465976
- DOI: 10.1007/978-3-540-75757-3_14
Detection of spatial activation patterns as unsupervised segmentation of fMRI data
Abstract
In functional connectivity analysis, networks of interest are defined based on correlation with the mean time course of a user-selected 'seed' region. In this work we propose to simultaneously estimate the optimal representative time courses that summarize the fMRI data well and the partition of the volume into a set of disjoint regions that are best explained by these representative time courses. Our approach offers two advantages. First, is removes the sensitivity of the analysis to the details of the seed selection. Second, it substantially simplifies group analysis by eliminating the need for a subject-specific threshold at which correlation values are deemed significant. This unsupervised technique generalizes connectivity analysis to situations where candidate seeds are difficult to identify reliably or are unknown. Our experimental results indicate that the functional segmentation provides a robust, anatomically meaningful and consistent model for functional connectivity in fMRI.
Figures


References
-
- Baumgartner R, et al. Fuzzy clustering of gradient-echo functional MRI in the human visual cortex. J. Magnetic Resonance Imaging. 1997;7(6):1094–1101. - PubMed
-
- Beckmann CF, Smith SM. Tensorial Extensions of Independent Component Analysis for Group FMRI Data Analysis. NeuroImage. 2005;25(1):294–311. - PubMed
-
- Bell AJ, Sejnowski TJ. An information-maximization approach to blind separation and blind deconvolution. Neural Computation. 1995;7:1129–1159. - PubMed
-
- Biswal B, et al. Functional connectivity in the motor cortex of resting human brain using echo-planar MRI. Magnetic Resonance in Medicine. 1995;34:537–541. - PubMed
-
- Cordes D, et al. Hierarchical clustering to measure connectivity in fMRI resting-state data. Magnetic Resonance Imaging. 2002;20(4):305–317. - PubMed
Publication types
MeSH terms
Grants and funding
LinkOut - more resources
Full Text Sources
Medical
