

Galactomutarotase and other galactose-related genes are rapidly induced by retinoic acid in human myeloid cells
- PMID: 18052213
- PMCID: PMC2527030
- DOI: 10.1021/bi701891t
Galactomutarotase and other galactose-related genes are rapidly induced by retinoic acid in human myeloid cells
Abstract
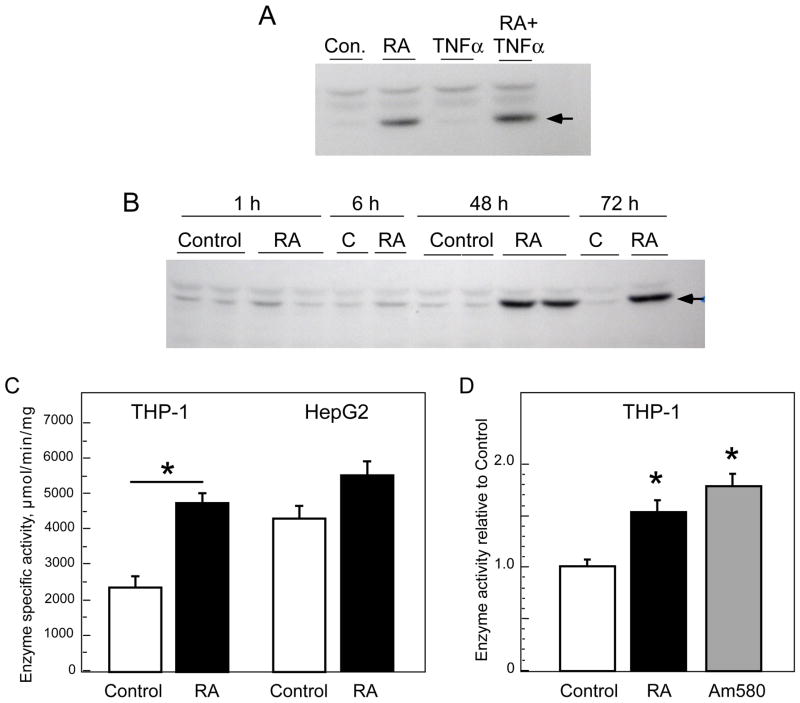
Aldose-1-epimerase (mutarotase) catalyzes the interconversion of alpha and beta hexoses, which is essential for normal carbohydrate metabolism and the production of complex oligosaccharides. Galactose mutarotase (GALM) has been well characterized at the protein level, but information is lacking on the regulation of GALM gene expression. We report herein that all-trans-retinoic acid (RA), an active metabolite of vitamin A that is known to induce myeloid lineage cell differentiation into macrophage-like cells, induces a rapid and robust regulation of GALM mRNA expression in human myeloid cells. all-trans-RA at a physiological concentration (20 nM), or Am580, a ligand selective for the nuclear retinoid receptor RARalpha, increased GALM mRNA in THP-1 cells, with significantly increased expression in 2 h, increasing further to an approximately 8-fold elevation after 6-40 h (P < 0.005). In contrast, tumor necrosis factor-alpha did not increase GALM mRNA expression, although it is capable of inducing cell differentiation. RA also increased GALM mRNA in U937 and HL-60 cells. The increase in GALM mRNA by RA was blocked by pretreating THP-1 cells with actinomycin D but not by cycloheximide. GALM protein and mutarotase activity were also increased time dependently in RA-treated THP-1 cells. In addition to GALM, several other genes in the biosynthetic pathway of galactosyl-containing complex oligosaccharides were more highly expressed in RA-treated THP-1 cells, including B4GALT5, ST3GAL3, ST6GALNAC5, and GALNAC4S-6ST. Thus, the results of this study identify RA as a significant regulator of GALM and other galactose-related genes in myeloid-monocytic cells, which could affect energy utilization and synthesis of cell-surface glycoproteins or glycolipids involved in cell motility, adhesion, and/or functional properties.
Figures


Similar articles
-
Retinoic acid regulates CD1d gene expression at the transcriptional level in human and rodent monocytic cells.Exp Biol Med (Maywood). 2007 Apr;232(4):488-94. Exp Biol Med (Maywood). 2007. PMID: 17392484 Free PMC article.
-
Retinoid-induced differentiation of acute promyelocytic leukemia involves PML-RARalpha-mediated increase of type II transglutaminase.Blood. 1996 Mar 1;87(5):1939-50. Blood. 1996. PMID: 8634442
-
Regulation of stearoyl coenzyme A desaturase expression in human retinal pigment epithelial cells by retinoic acid.J Biol Chem. 2001 Aug 3;276(31):28744-50. doi: 10.1074/jbc.M103587200. Epub 2001 Jun 7. J Biol Chem. 2001. PMID: 11397803
-
Carbohydrate utilization in Streptococcus thermophilus: characterization of the genes for aldose 1-epimerase (mutarotase) and UDPglucose 4-epimerase.J Bacteriol. 1990 Jul;172(7):4037-47. doi: 10.1128/jb.172.7.4037-4047.1990. J Bacteriol. 1990. PMID: 1694527 Free PMC article.
-
The structural and molecular biology of type IV galactosemia.Biochimie. 2021 Apr;183:13-17. doi: 10.1016/j.biochi.2020.11.001. Epub 2020 Nov 9. Biochimie. 2021. PMID: 33181226 Review.
Cited by
-
Retinoic acid and tumor necrosis factor-α induced monocytic cell gene expression is regulated in part by induction of transcription factor MafB.Exp Cell Res. 2012 Nov 1;318(18):2407-16. doi: 10.1016/j.yexcr.2012.07.011. Epub 2012 Jul 20. Exp Cell Res. 2012. PMID: 22820162 Free PMC article.
-
Comprehensive Analyses of Glucose Metabolism in Glioma Reveal the Glioma-Promoting Effect of GALM.Front Cell Dev Biol. 2022 Jan 20;9:717182. doi: 10.3389/fcell.2021.717182. eCollection 2021. Front Cell Dev Biol. 2022. PMID: 35127693 Free PMC article.
-
DHRS3, a retinal reductase, is differentially regulated by retinoic acid and lipopolysaccharide-induced inflammation in THP-1 cells and rat liver.Am J Physiol Gastrointest Liver Physiol. 2012 Sep 1;303(5):G578-88. doi: 10.1152/ajpgi.00234.2012. Epub 2012 Jul 12. Am J Physiol Gastrointest Liver Physiol. 2012. PMID: 22790594 Free PMC article.
-
Comparative proteomic analysis reveals different responses in porcine lymph nodes to virulent and attenuated homologous African swine fever virus strains.Vet Res. 2018 Sep 12;49(1):90. doi: 10.1186/s13567-018-0585-z. Vet Res. 2018. PMID: 30208957 Free PMC article.
-
Induction of the galactose enzymes in Escherichia coli is independent of the C-1-hydroxyl optical configuration of the inducer D-galactose.J Bacteriol. 2008 Dec;190(24):7932-8. doi: 10.1128/JB.01008-08. Epub 2008 Oct 17. J Bacteriol. 2008. PMID: 18931131 Free PMC article.
References
-
- Holden HM, Rayment I, Thoden JB. Structure and function of enzymes of the Leloir pathway for galactose metabolism. J Biol Chem. 2003;278:43885–43888. - PubMed
-
- Frey PA. The Leloir pathway: a mechanistic imperative for three enzymes to change the stereochemical configuration of a single carbon in galactose. FASEB J. 1996;10:461–470. - PubMed
-
- Thoden JB, Holden HM. High resolution X-ray structure of galactose mutarotase from Lactococcus lactis. J Biol Chem. 2002;277:20854–20861. - PubMed
-
- Thoden JB, Kim J, Raushel FM, Holden HM. Structural and kinetic studies of sugar binding to galactose mutarotase from Lactococcus lactis. J Biol Chem. 2002;277:45458–45465. - PubMed
-
- Timson DJ, Reece RJ. Identification and characterisation of human aldose 1-epimerase. FEBS Lett. 2003;543:21–24. - PubMed
Publication types
MeSH terms
Substances
Grants and funding
LinkOut - more resources
Full Text Sources
Molecular Biology Databases
