

Intragenomic matching reveals a huge potential for miRNA-mediated regulation in plants
- PMID: 18052543
- PMCID: PMC2098865
- DOI: 10.1371/journal.pcbi.0030238
Intragenomic matching reveals a huge potential for miRNA-mediated regulation in plants
Abstract
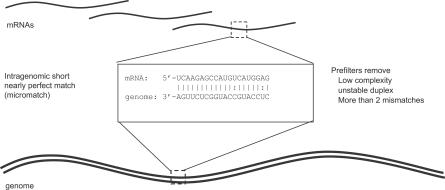
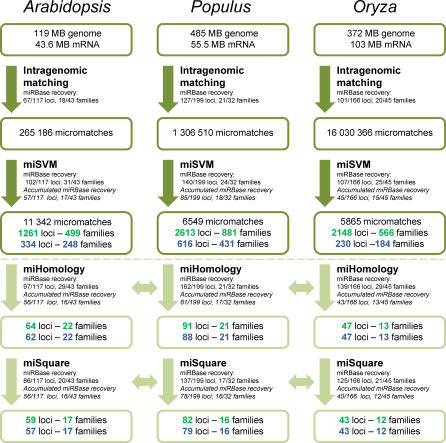
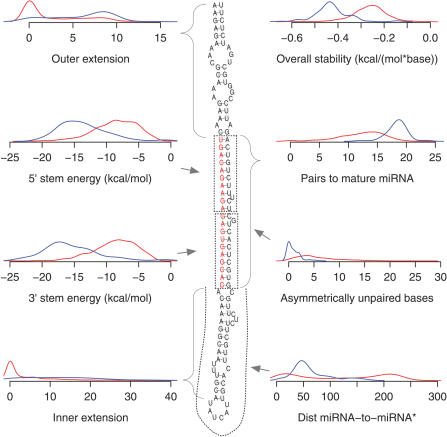
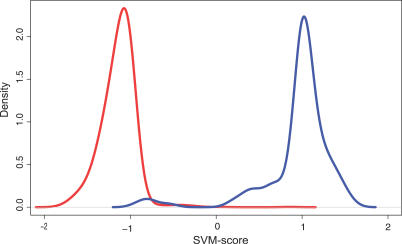
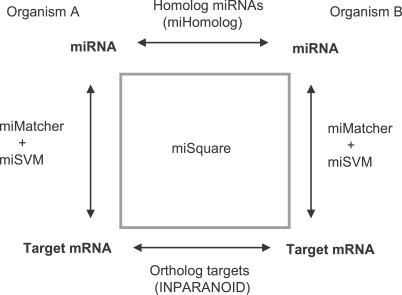
microRNAs (miRNAs) are important post-transcriptional regulators, but the extent of this regulation is uncertain, both with regard to the number of miRNA genes and their targets. Using an algorithm based on intragenomic matching of potential miRNAs and their targets coupled with support vector machine classification of miRNA precursors, we explore the potential for regulation by miRNAs in three plant genomes: Arabidopsis thaliana, Populus trichocarpa, and Oryza sativa. We find that the intragenomic matching in conjunction with a supervised learning approach contains enough information to allow reliable computational prediction of miRNA candidates without requiring conservation across species. Using this method, we identify approximately 1,200, approximately 2,500, and approximately 2,100 miRNA candidate genes capable of extensive base-pairing to potential target mRNAs in A. thaliana, P. trichocarpa, and O. sativa, respectively. This is more than five times the number of currently annotated miRNAs in the plants. Many of these candidates are derived from repeat regions, yet they seem to contain the features necessary for correct processing by the miRNA machinery. Conservation analysis indicates that only a few of the candidates are conserved between the species. We conclude that there is a large potential for miRNA-mediated regulatory interactions encoded in the genomes of the investigated plants. We hypothesize that some of these interactions may be realized under special environmental conditions, while others can readily be recruited when organisms diverge and adapt to new niches.
Conflict of interest statement
Figures
Similar articles
-
Prediction of Plant miRNA Targets.Methods Mol Biol. 2019;1932:99-107. doi: 10.1007/978-1-4939-9042-9_7. Methods Mol Biol. 2019. PMID: 30701494
-
Prediction and identification of Arabidopsis thaliana microRNAs and their mRNA targets.Genome Biol. 2004;5(9):R65. doi: 10.1186/gb-2004-5-9-r65. Epub 2004 Aug 31. Genome Biol. 2004. PMID: 15345049 Free PMC article.
-
Prediction of plant pre-microRNAs and their microRNAs in genome-scale sequences using structure-sequence features and support vector machine.BMC Bioinformatics. 2014 Dec 30;15(1):423. doi: 10.1186/s12859-014-0423-x. BMC Bioinformatics. 2014. PMID: 25547126 Free PMC article.
-
A potential role of microRNAs in plant response to metal toxicity.Metallomics. 2013 Sep;5(9):1184-90. doi: 10.1039/c3mt00022b. Metallomics. 2013. PMID: 23579282 Review.
-
Plant microRNAs: an insight into their gene structures and evolution.Semin Cell Dev Biol. 2010 Oct;21(8):782-9. doi: 10.1016/j.semcdb.2010.07.009. Epub 2010 Aug 4. Semin Cell Dev Biol. 2010. PMID: 20691276 Review.
Cited by
-
PMRD: plant microRNA database.Nucleic Acids Res. 2010 Jan;38(Database issue):D806-13. doi: 10.1093/nar/gkp818. Epub 2009 Oct 6. Nucleic Acids Res. 2010. PMID: 19808935 Free PMC article.
-
Integrated microRNA and mRNA expression profiling in a rat colon carcinogenesis model: effect of a chemo-protective diet.Physiol Genomics. 2011 May 1;43(10):640-54. doi: 10.1152/physiolgenomics.00213.2010. Epub 2011 Mar 15. Physiol Genomics. 2011. PMID: 21406606 Free PMC article.
-
Differential effects of viral silencing suppressors on siRNA and miRNA loading support the existence of two distinct cellular pools of ARGONAUTE1.EMBO J. 2012 May 30;31(11):2553-65. doi: 10.1038/emboj.2012.92. Epub 2012 Apr 24. EMBO J. 2012. PMID: 22531783 Free PMC article.
-
In silico miRNA prediction in metazoan genomes: balancing between sensitivity and specificity.BMC Genomics. 2009 Apr 30;10:204. doi: 10.1186/1471-2164-10-204. BMC Genomics. 2009. PMID: 19405940 Free PMC article.
-
A specific dsRNA-binding protein complex selectively sequesters endogenous inverted-repeat siRNA precursors and inhibits their processing.Nucleic Acids Res. 2017 Feb 17;45(3):1330-1344. doi: 10.1093/nar/gkw1264. Nucleic Acids Res. 2017. PMID: 28180322 Free PMC article.
References
Publication types
MeSH terms
Substances
LinkOut - more resources
Full Text Sources
Other Literature Sources
