

doi: 10.1186/gb-2007-8-12-r258.
Broad network-based predictability of Saccharomyces cerevisiae gene loss-of-function phenotypes
Affiliations
- PMID: 18053250
- PMCID: PMC2246260
- DOI: 10.1186/gb-2007-8-12-r258
Item in Clipboard
Broad network-based predictability of Saccharomyces cerevisiae gene loss-of-function phenotypes
Genome Biol.
2007.
Abstract
We demonstrate that loss-of-function yeast phenotypes are predictable by guilt-by-association in functional gene networks. Testing 1,102 loss-of-function phenotypes from genome-wide assays of yeast reveals predictability of diverse phenotypes, spanning cellular morphology, growth, metabolism, and quantitative cell shape features. We apply the method to extend a genome-wide screen by predicting, then verifying, genes whose disruption elongates yeast cells, and to predict human disease genes. To facilitate network-guided screens, a web server is available http://www.yeastnet.org.
Figures
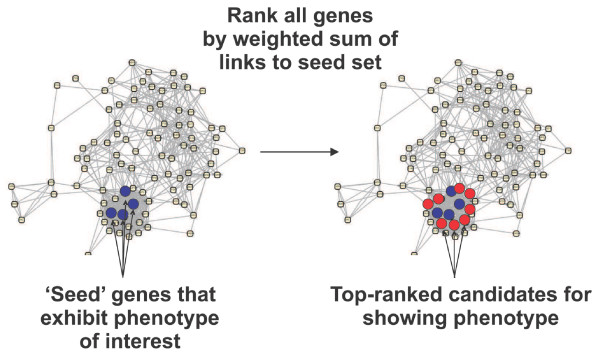
Overview of guilt-by-association phenotype prediction. Guilt-by-association phenotype prediction employs a functional gene network, represented here as circles (genes) connected by lines (functional linkages), and a seed set of genes (blue filled circles) whose disruption is known to give rise to the phenotype of interest. Neighboring genes in a functional gene network (red filled circles) are candidates for also giving rise to the phenotype. Candidates are prioritized by the sum of their network linkage weights to the set of seed genes. A gene strongly linked to multiple seed genes will thus rank more highly than a gene weakly linked to a single seed gene. Networks in Figures 1, 5, and 7 were drawn with Cytoscape [73].
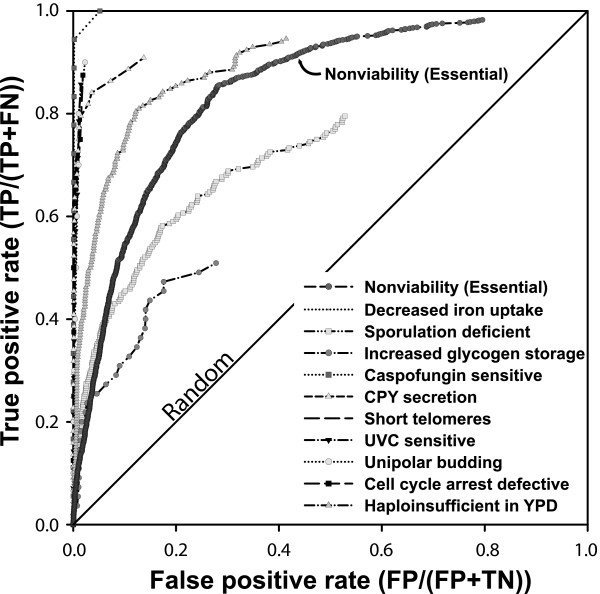
Diverse yeast gene loss-of-function phenotypes are predictable using guilt-by-association in a functional gene network. Predictability is measured in a receiver operating characteristic plot of the true positive rate (sensitivity) versus false positive rate (1 - specificity) for predicting genes giving rise to ten specific loss-of-function phenotypes, as well as for essential genes whose disruption produces nonviable yeast [4]. For each phenotype, each gene in the yeast genome was prioritized by the sum of the weights of its network linkages to the seed genes associated with the phenotype. Genes with higher scores are more tightly linked to the seed set and therefore more likely to give rise to the phenotype. Each phenotype was evaluated using leave-one-out cross-validation, omitting genes from the seed set for the purposes of evaluation. More predictable phenotypes tend toward the top-left corner of the graph; random predictability is indicated by the diagonal. For clarity, the line connecting the final point of each graph to the top right corner has been omitted. FN, false negative; FP, false positive; TN, true negative; TP, true positive.
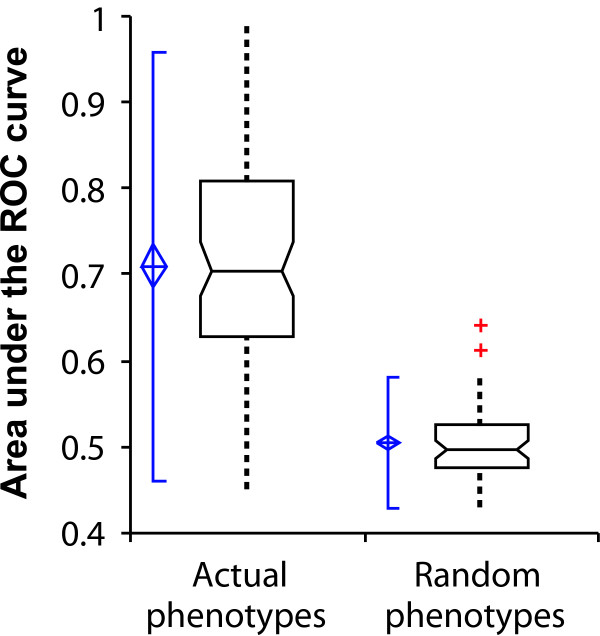
Loss-of-function phenotypes are predicted significantly better than random expectation. Here, predictability is measured as the area under a receiver operating characteristic (ROC) curve (AUC), measuring the AUC for each of 100 yeast phenotypes observed in genome-wide screens and plotting the resulting AUC distributions. Real phenotypes are significantly more predictable than size-matched random gene sets. At the left of each box-and-whisker plot, the center of the blue diamond indicates the AUC mean, the top and bottom of the diamond indicate the 95% confidence interval, and the accompanying solid vertical line indicates ± 2 standard deviations. The bottom, middle, and top horizontal lines of the box-and-whisker plots represent the first quartile, the median, and the third quartile of AUCs, respectively; whiskers indicate 1.5 times the interquartile range. Red plus signs represent individual outliers.
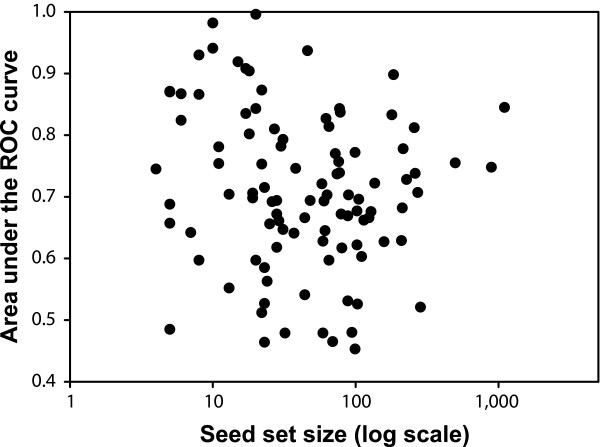
A plot of seed set size versus predictability of the phenotype shows no significant correlation. Thus, there does not appear to be an intrinsic limitation for applying network-guided reverse genetics even when seed set size is small. Each filled circle indicates the prediction strength (area under the receiver operating characteristic [ROC] curve, as calculated in Figure 3) of one of the 100 loss-of-function phenotypes relative to the number of genes in that seed set.
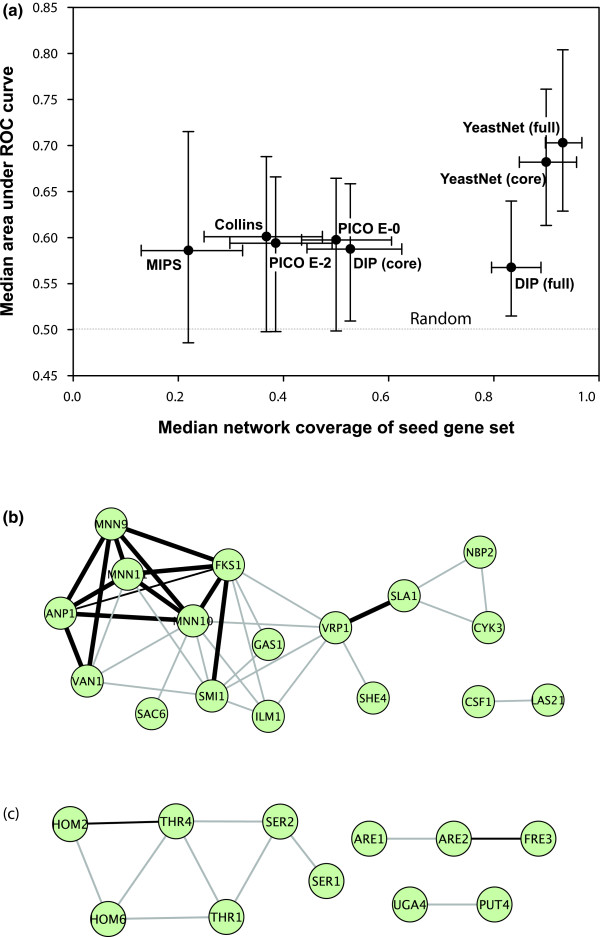
Relative predictive power of functional and physical protein networks. (a) Median values of predictive power (area under the receiver operating characteristic [ROC] curve [AUC]) across 100 loss-of-function phenotypes are plotted versus the median fraction of each seed gene set covered by a network (coverage; measured as the fraction of seed genes with at least one linkage in the network). Five networks are compared: the functional yeast network (YeastNet v. 2 [24]) and four versions of the network of yeast physical protein interactions (Database of Interacting Proteins [DIP] [45], Probabilistic Integrated Co-complex [PICO] [29], Munich Information Center for Protein Sequences [MIPS] physical complexes [44], and Collins and coworkers [43]). DIP, PICO, and YeastNet are each evaluated at two reported confidence thresholds. The YeastNet functional gene network shows considerably higher predictive power than for the networks composed only of physical interactions; the full YeastNet shows higher predictive power than a more confident core set of the top 47,000 linkages, indicating that the lower confidence linkages nonetheless add predictive power. Error bars indicate the first and third quartiles. Panels b and c show example seed gene sets (green circles) and their network connections, indicating functional linkages in grey lines, physical interactions in thin black lines, and both functional and physical interactions in thick black lines. (b) Genes whose deletion increases cellular chitin levels [33] (AUC = 0.87), whose prediction relies upon a mix of physical and functional interactions. (c) Genes whose deletion confers sensitivity at 5 generations in synthetic complete medium lacking threonine [4] (AUC = 0.65), whose prediction derives predominantly from functional linkages.
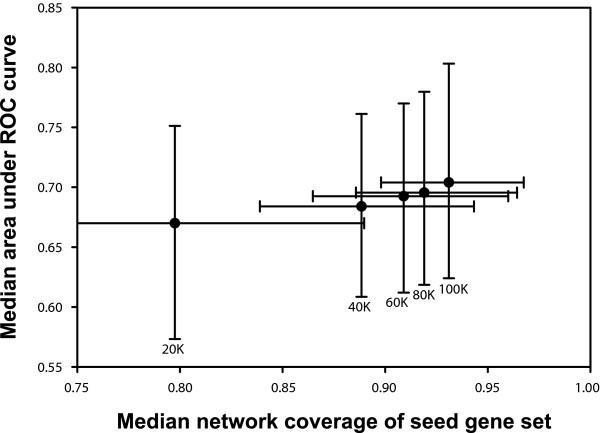
Lower probability linkages continue to improve predictive accuracy. The continued improvement of predictions, albeit with diminishing returns, is shown in a plot of the predictive accuracy (median area under the receiver operating characteristic [ROC] curve across the 100 phenotypes, calculated as in Figure 3) versus median network coverage of the 100 phenotype sets, as calculated for the top-ranked 20,000 (20 K), 40,000 (40 K), 60,000 (60 K), 80,000 (80 K), and 100,000 (100 K) linkages in YeastNet v. 2. This trend derives from the fact that all links in this network have at least a 60% probability of linking genes in the same pathway. The probabilistic nature of the network means that low confidence linkages are unlikely to undercut high confidence linkages during phenotype prediction because the links are weighted according to the strength of the evidence supporting them. Error bars indicate the first and third quartiles.
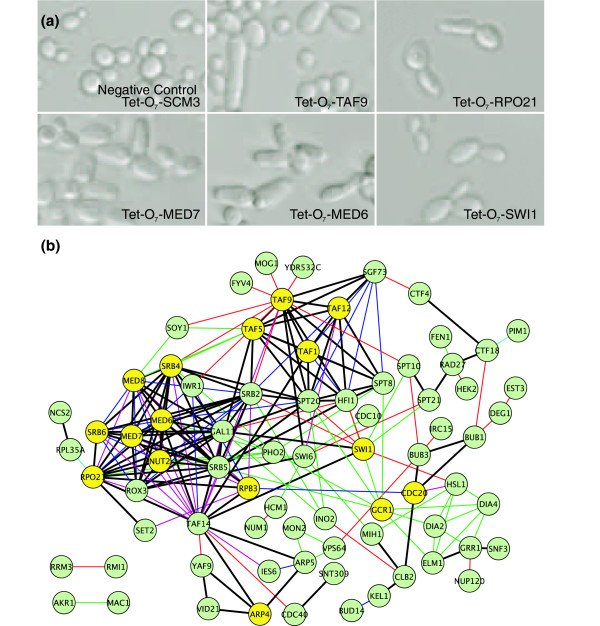
Network-guided extension of a genetic screen. Guilt-by-association (GBA) was applied to predict essential yeast genes whose disruption resulted in elongated yeast cells, based on the genes' network connectivity to a seed set of 77 nonessential genes already known to cause cell elongation when deleted [4]. (a) Five examples of successful predictions, observed in yeast strains carrying tetracycline downregulatable conditional alleles [47] of the essential genes TAF9, MED6, MED7, SWI1, and RPO21. In contrast, conditional downregulation of an unrelated essential gene, SCM3, caused no such cell elongation. (b) Sixteen out of 33 tested essential genes (yellow circles) showed elongated cell phenotypes on the basis of their connections to the seed set genes (green circles), with particular enrichment for genes associated with RNA polymerase II transcriptional initiation and the mediator complex. The color of the edge between two genes indicates the source of evidence supporting the functional link: thick black, multiple types of evidence; blue, affinity purification/mass spectrometry; green, literature mining by co-citation; cyan, gene neighbors or tertiary structure; pink, literature curated physical interaction; and red, genetic interaction.
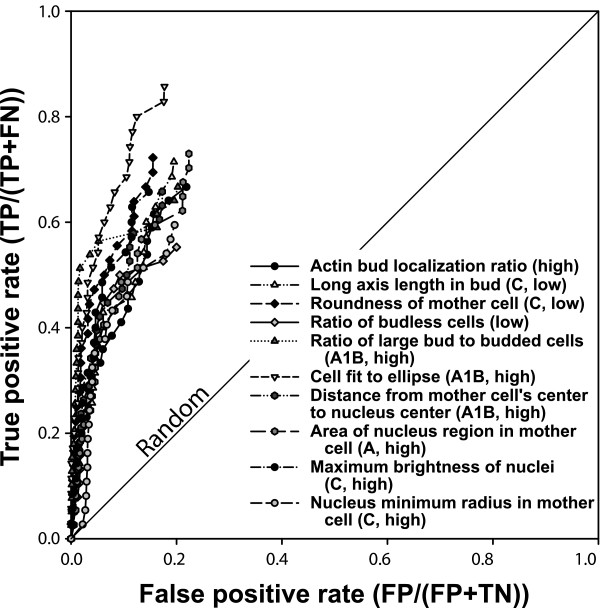
Network-based prediction of quantitative cell morphology phenotypes. A wide variety of phenotypes based upon quantitative yeast cell shape and intracellular features [46] are predictable, as shown for the ten phenotypes in this receiver operating characteristic (ROC) analysis (selected from S. cerevisiae Morphology Database [SCMD] phenotypes with area under the ROC curve [AUC] > 0.68). For each of the features, the 40 genes whose deletion mutants show either the 40 highest or 40 lowest values for that quantitative feature (indicated by 'high' or 'low', respectively) were selected as the seed gene set. Predictability was evaluated using ROC analysis as in Figure 2, plotting the true positive prediction rate versus false positive rate, using leave-one-out cross-validation. For clarity, the line connecting the final point of each graph to the top right corner has been omitted. Labels of features are adapted for clarity from the SCMD [50]; the SCMD labels A, A1B, and C represent unbudded cells, budded cell with one nucleus in mother cell, and large-budded post-mitotic cells with nuclei in both mother and daughter cell, respectively. Ratio measurements refer to proportions across a population of cells. FN, false negative; FP, false positive; TN, true negative; TP, true positive.
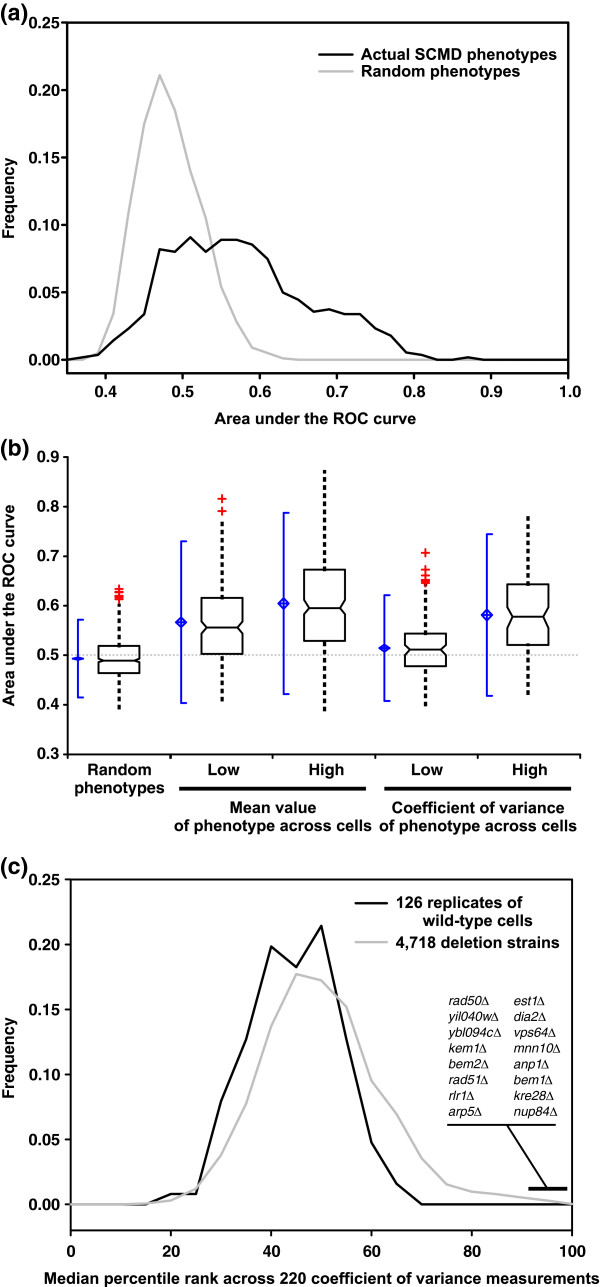
Quantitative cell morphology phenotypes are predicted significantly better than random expectation. In contrast, genes whose disruption decreases population co-efficient of variance (CV) were not predictable. (a) A histogram plotting the distribution of the area under the receiver operating characteristic (ROC) curve (AUC) values for 562 quantitative morphological phenotypes shows a significantly higher proportion of high AUC values than for 1,000 size-matched random gene sets. (b) Separate analyses of phenotypes associated with morphologic features and phenotypes associated with cell-to-cell variability in the morphologic features reveals asymmetry in predictability. Sets of genes whose disruption causes the 40 largest or smallest mean values of a morphological feature (middle plots) are significantly more predictable than random gene sets (left side). By contrast, although the sets of genes whose disruption most increase the CV tend to be predictable (high AUC), those that most decrease the CV are not (low AUC). Box-and-whisker plots are drawn as in Figure 3. (c) A comparison of the median phenotypic CVs observed for deletion strains versus replicate analyses of wild-type cells shows that deletion strains with the most reduced CVs are essentially wild-type-like in character, whereas those with the most increased CVs show significantly more cell-to-cell variability than wild-type cells. These latter knockout strains carry deletions for genes predominantly involved in maintaining genomic integrity. This trend is therefore likely to have arisen from nonclonal genetic variation in these strains, recapitulating the classic mutator phenotype.
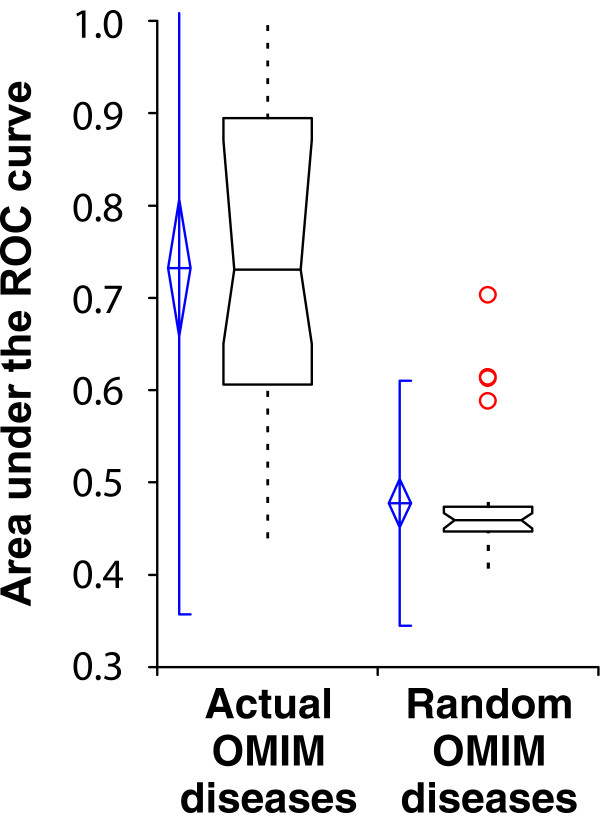
Yeast genes with human orthologs linked to the same diseases are predicted better than random expectation. Predictability is measured as the area under a receiver operating characteristic (ROC) curve (AUC), as in Figure 3, measuring the AUC for each of 28 human diseases reported in the Online Mendelian Inheritance in Man (OMIM) disease database [51] that have four or more yeast orthologs annotated in the yeast function network and plotting the resulting AUC distributions. Real disease gene sets are significantly more predictable than size-matched random gene sets drawn from the set of yeast-human orthologs. Box plots are drawn as in Figure 3.
References
Publication types
MeSH terms
Substances
Grants and funding
LinkOut - more resources
Full Text Sources
Molecular Biology Databases
