

Downregulation of plasma insulin levels and hepatic PPARgamma expression during the first week of caloric restriction in mice
- PMID: 18053669
- PMCID: PMC2350197
- DOI: 10.1016/j.exger.2007.10.011
Downregulation of plasma insulin levels and hepatic PPARgamma expression during the first week of caloric restriction in mice
Abstract
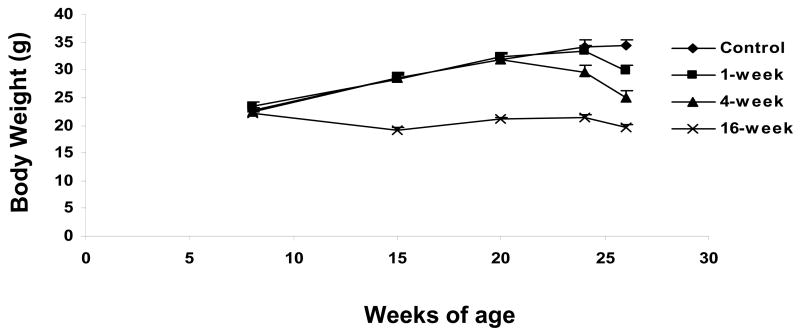
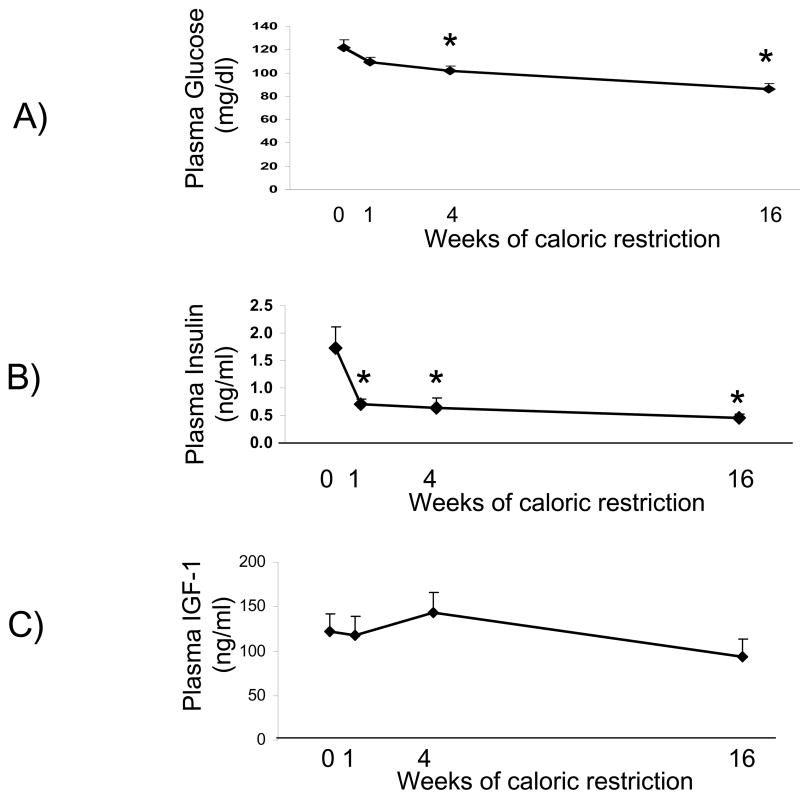
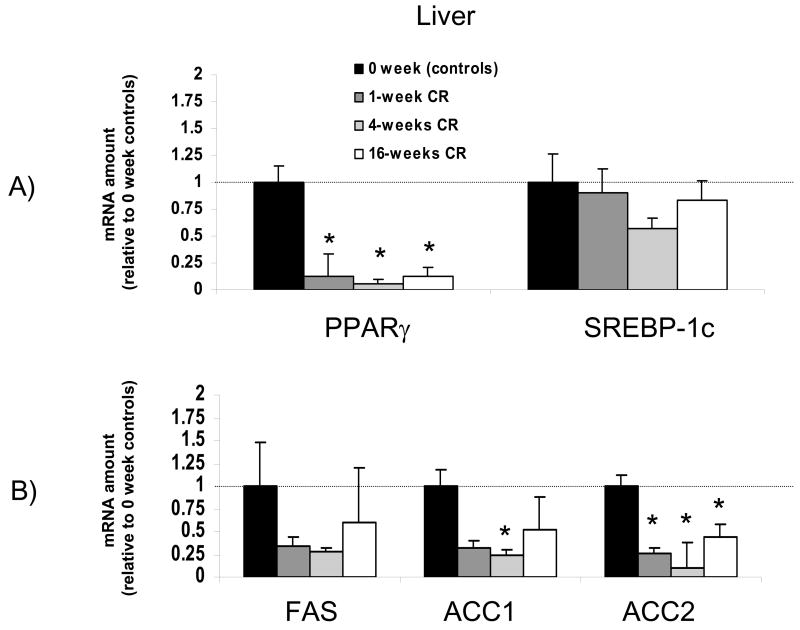
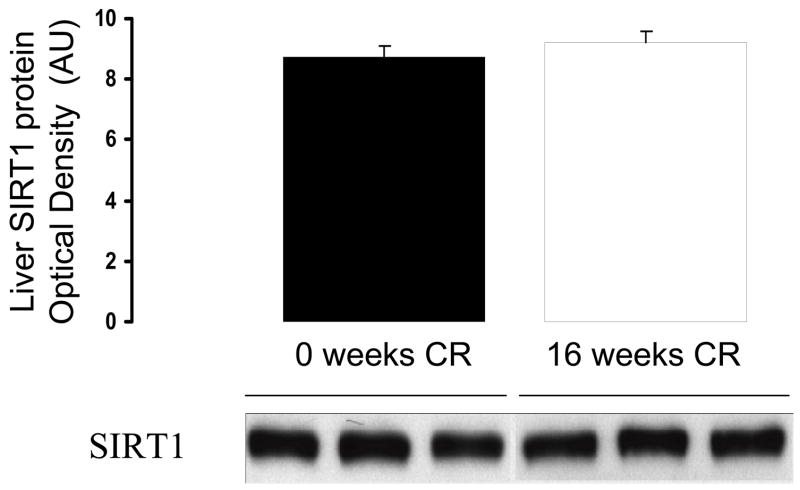
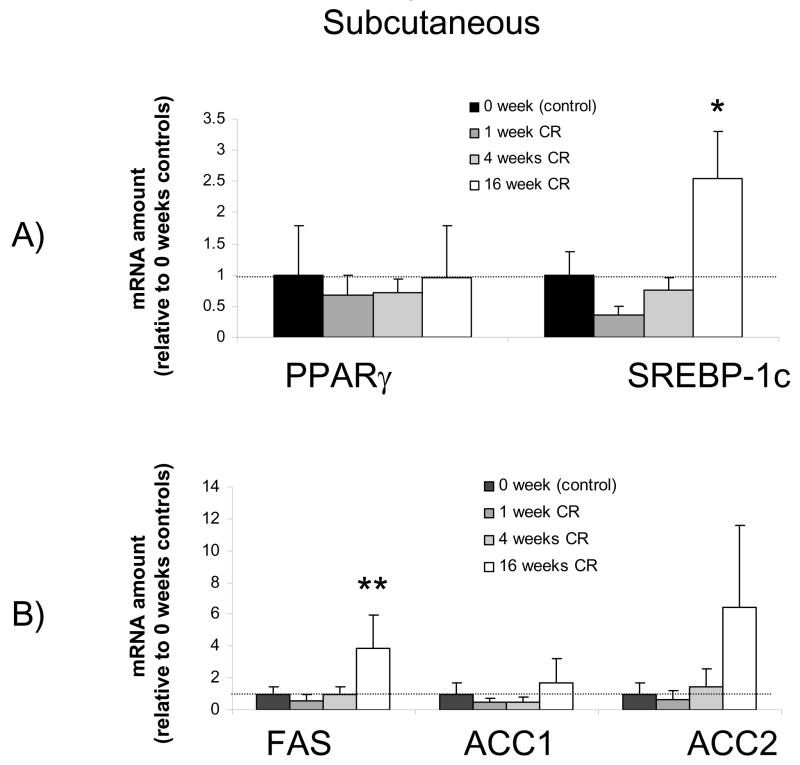
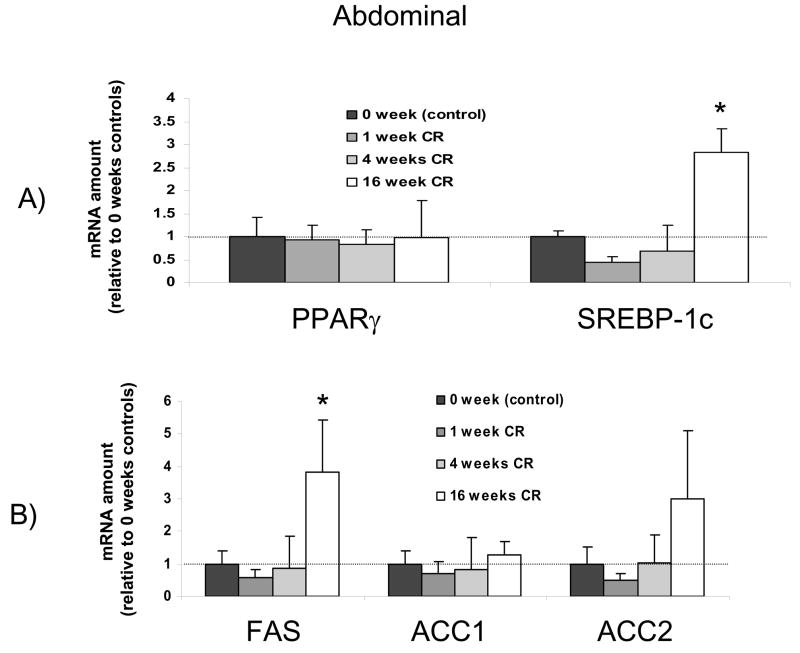
Calorie restriction extends lifespan by decreasing the rate of tumor formation, an effect occurring within 8 weeks of initiating a restricted diet. Our goal was to define how the first weeks of a calorie restricted diet (60% of ad libitum calories) affects putative mediators of the calorie restriction phenotype, focusing on regulators of fatty acid biosynthesis. In C57Bl/6 mice, insulin decreased over 50% (p<0.05) during the first week of calorie restriction whereas IGF-1 was unaffected. In the liver, PPARgamma mRNA fell to 13% of baseline after 1 week of calorie restriction (p<0.05), whereas hepatic SREBP-1c and SIRT1 mRNA levels were unaffected. No changes in abdominal or subcutaneous adipose tissue were observed until after 4 weeks of caloric restriction. We conclude that calorie restriction-induced decreases in insulin and hepatic PPARgamma are rapid enough to support a role for these molecules in triggering the initial phase of the calorie restriction phenotype.
Figures
Similar articles
-
Effect of medium- and long-chain fatty acid diets on PPAR and SREBP-1 expression and glucose homeostasis in ACBP-overexpressing transgenic rats.Acta Physiol (Oxf). 2008 Sep;194(1):57-65. doi: 10.1111/j.1748-1716.2008.01860.x. Epub 2008 Apr 3. Acta Physiol (Oxf). 2008. PMID: 18394026
-
[Effects of calorie restriction on SIRT1 expression in liver of nonalcoholic fatty liver disease: experiment with rats].Zhonghua Yi Xue Za Zhi. 2007 May 29;87(20):1434-7. Zhonghua Yi Xue Za Zhi. 2007. PMID: 17785073 Chinese.
-
Effect of exercise and calorie restriction on biomarkers of aging in mice.Am J Physiol Regul Integr Comp Physiol. 2008 May;294(5):R1618-27. doi: 10.1152/ajpregu.00890.2007. Epub 2008 Mar 5. Am J Physiol Regul Integr Comp Physiol. 2008. PMID: 18321952 Free PMC article.
-
Calorie restriction--the SIR2 connection.Cell. 2005 Feb 25;120(4):473-82. doi: 10.1016/j.cell.2005.01.029. Cell. 2005. PMID: 15734680 Review.
-
[Metabolic Alteration in Aging Process: Metabolic Remodeling in White Adipose Tissue by Caloric Restriction].Yakugaku Zasshi. 2020;140(3):383-389. doi: 10.1248/yakushi.19-00193-2. Yakugaku Zasshi. 2020. PMID: 32115557 Review. Japanese.
Cited by
-
Does calorie restriction induce mitochondrial biogenesis? A reevaluation.FASEB J. 2011 Feb;25(2):785-91. doi: 10.1096/fj.10-170415. Epub 2010 Nov 3. FASEB J. 2011. PMID: 21048043 Free PMC article.
-
Comprehensive evaluation of caloric restriction-induced changes in the metabolome profile of mice.Nutr Metab (Lond). 2022 Jun 27;19(1):41. doi: 10.1186/s12986-022-00674-4. Nutr Metab (Lond). 2022. PMID: 35761356 Free PMC article.
-
In vitro cellular adaptations of indicators of longevity in response to treatment with serum collected from humans on calorie restricted diets.PLoS One. 2008 Sep 15;3(9):e3211. doi: 10.1371/journal.pone.0003211. PLoS One. 2008. PMID: 18791640 Free PMC article.
-
Deficiency in mTORC1-controlled C/EBPβ-mRNA translation improves metabolic health in mice.EMBO Rep. 2015 Aug;16(8):1022-36. doi: 10.15252/embr.201439837. Epub 2015 Jun 25. EMBO Rep. 2015. PMID: 26113365 Free PMC article.
-
Korean Pine Nut Oil Attenuated Hepatic Triacylglycerol Accumulation in High-Fat Diet-Induced Obese Mice.Nutrients. 2016 Jan 21;8(1):59. doi: 10.3390/nu8010059. Nutrients. 2016. PMID: 26805879 Free PMC article.
References
-
- Argentino DP, Munoz MC, Rocha JS, Bartke A, Turyn D, Dominici FP. Horm Metab Res. 2005;37:672–9. - PubMed
-
- Assimacopoulos-Jeannet F, Brichard S, Rencurel F, Cusin I, Jeanrenaud B. Metabolism. 1995;44:228–33. - PubMed
-
- Barzilai N, Gabriely I. J Nutr. 2001;131:903S–906S. - PubMed
-
- Berrigan D, Perkins SN, Haines DC, Hursting SD. Carcinogenesis. 2002;23:817–22. - PubMed
-
- Blackwell BN, Bucci TJ, Hart RW, Turturro A. Toxicol Pathol. 1995;23:570–82. - PubMed
Publication types
MeSH terms
Substances
Grants and funding
LinkOut - more resources
Full Text Sources
Medical
Miscellaneous
