. 2008 Feb 15;39(4):1731-43.
doi: 10.1016/j.neuroimage.2007.10.031. Epub 2007 Nov 1.

Spatial patterns of brain atrophy in MCI patients, identified via high-dimensional pattern classification, predict subsequent cognitive decline

Affiliations

Spatial patterns of brain atrophy in MCI patients, identified via high-dimensional pattern classification, predict subsequent cognitive decline

Yong Fan et al. Neuroimage. .

Abstract

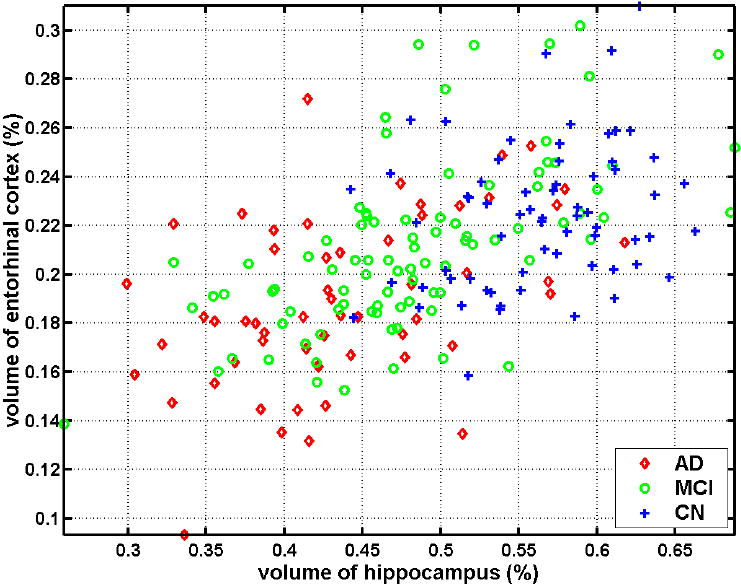
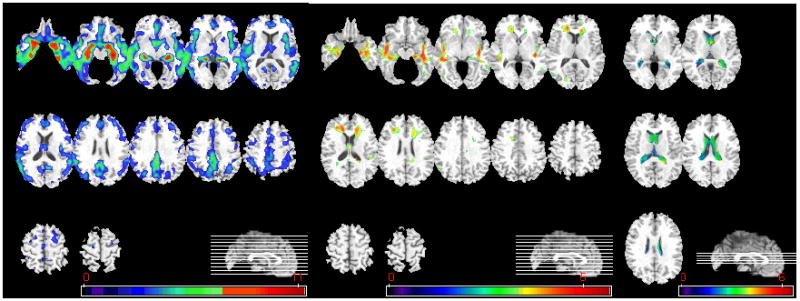
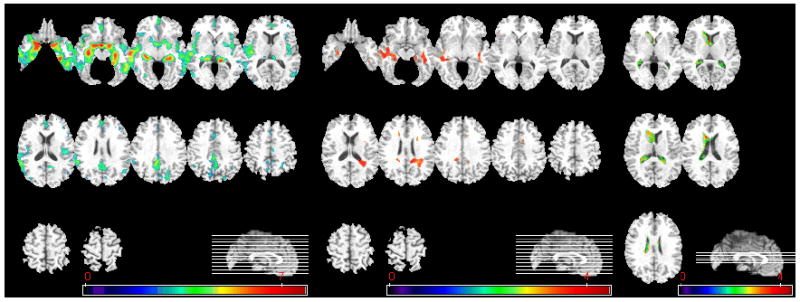
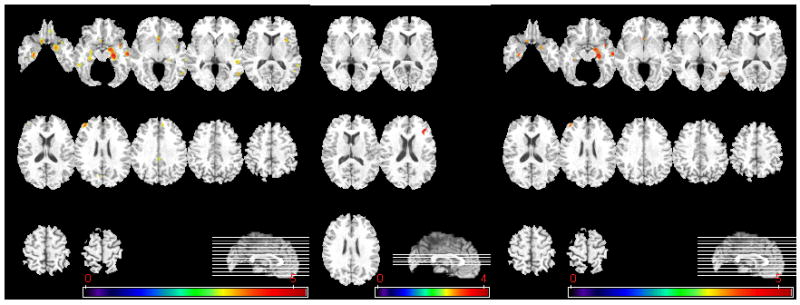
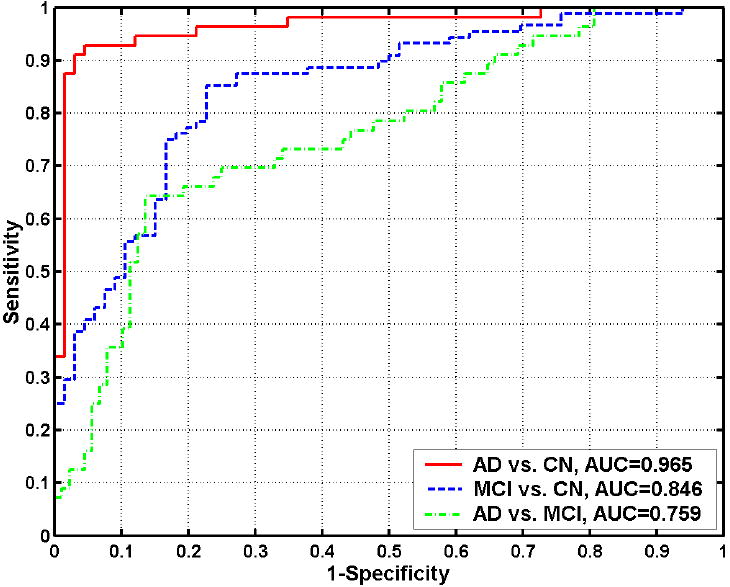
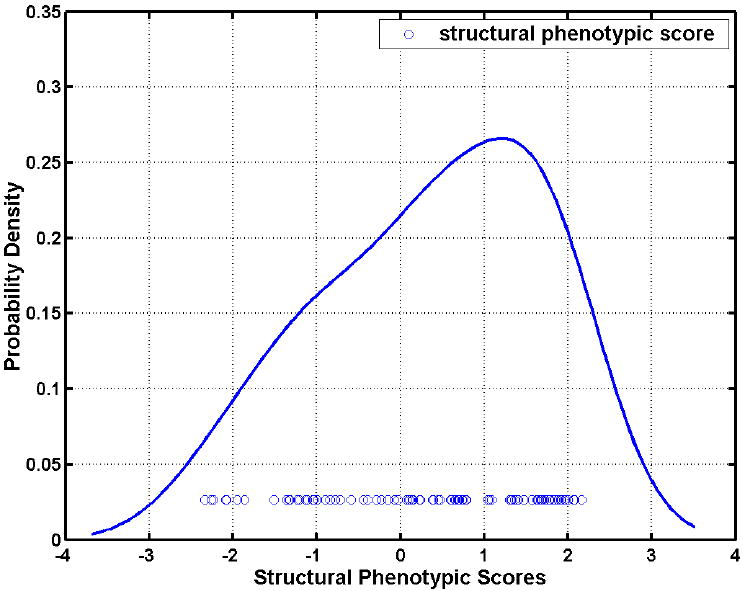
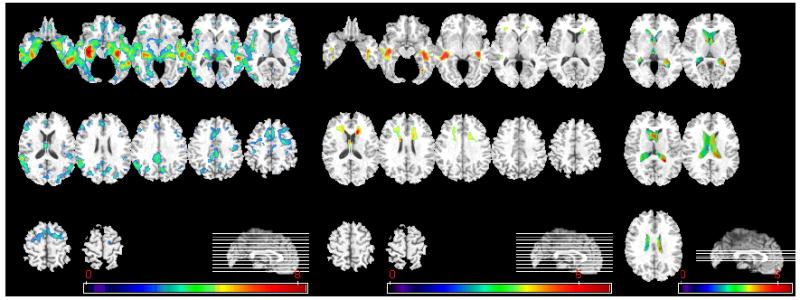
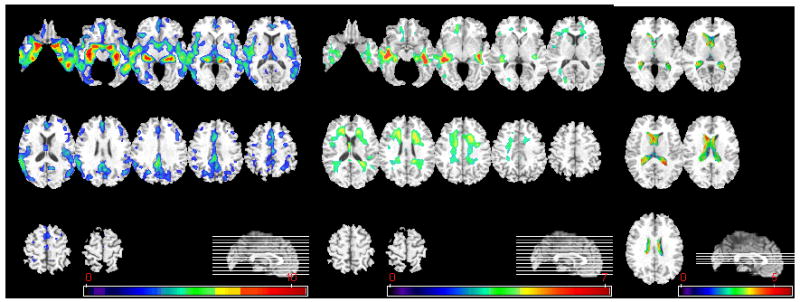
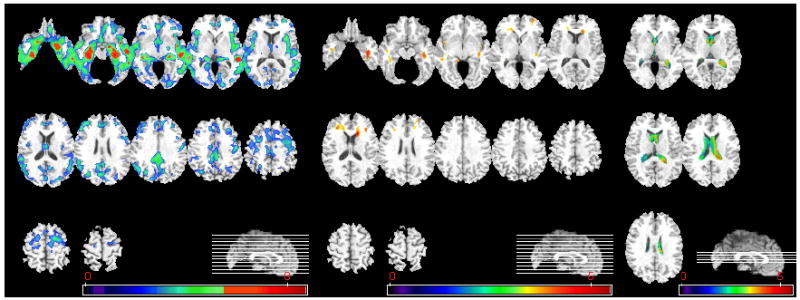
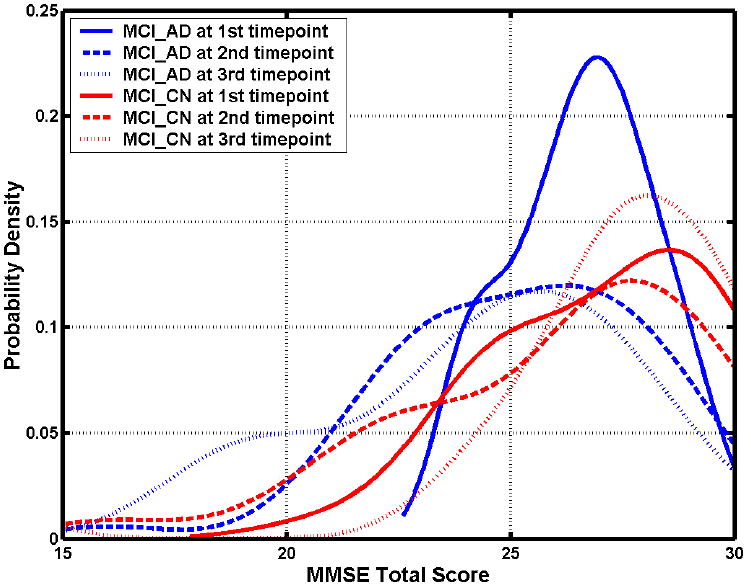
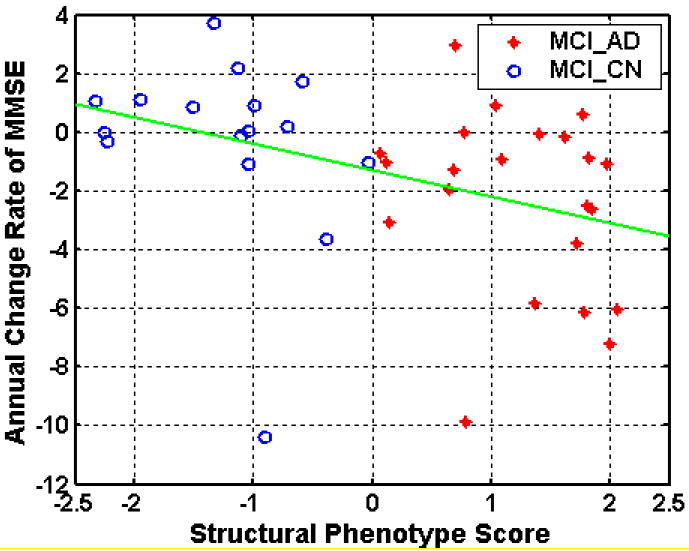
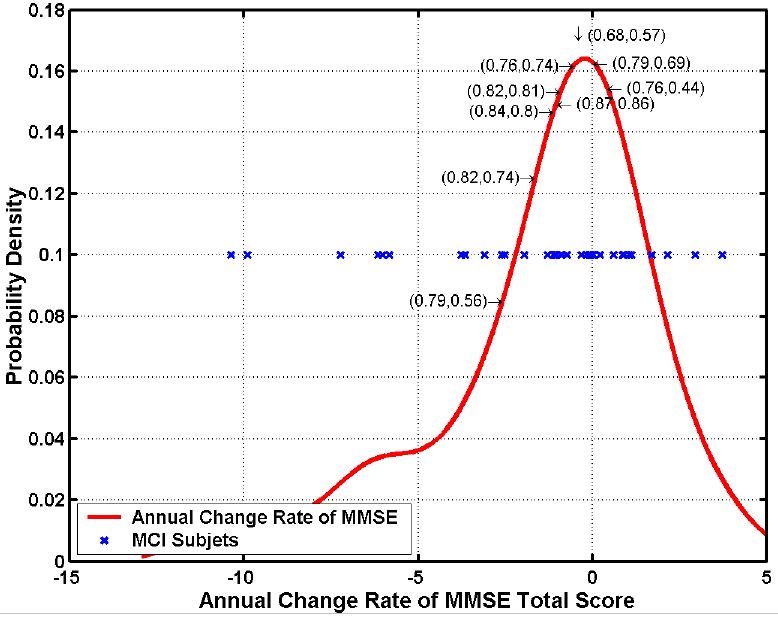
Spatial patterns of brain atrophy in mild cognitive impairment (MCI) and Alzheimer's disease (AD) were measured via methods of computational neuroanatomy. These patterns were spatially complex and involved many brain regions. In addition to the hippocampus and the medial temporal lobe gray matter, a number of other regions displayed significant atrophy, including orbitofrontal and medial-prefrontal grey matter, cingulate (mainly posterior), insula, uncus, and temporal lobe white matter. Approximately 2/3 of the MCI group presented patterns of atrophy that overlapped with AD, whereas the remaining 1/3 overlapped with cognitively normal individuals, thereby indicating that some, but not all, MCI patients have significant and extensive brain atrophy in this cohort of MCI patients. Importantly, the group with AD-like patterns presented much higher rate of MMSE decline in follow-up visits; conversely, pattern classification provided relatively high classification accuracy (87%) of the individuals that presented relatively higher MMSE decline within a year from baseline. High-dimensional pattern classification, a nonlinear multivariate analysis, provided measures of structural abnormality that can potentially be useful for individual patient classification, as well as for predicting progression and examining multivariate relationships in group analyses.


Figures

Figure 1
Figure 1
Scatter plot of the volumes of the hippocampus (left + right) against the entorhinal cortex (left + right) of the groups of CN, MCI, and AD, after normalization by ICV.
Figure 2
Figure 2
Voxel-based analysis of group difference between CN and AD. From left to right, group comparison results on GM, WM, and CSF are shown. (GM, WM: CN>AD, CSF: AD>CN, p<0.05, corrected). The color-maps indicate the scale for the t-statistic. Images are displayed in radiological convention.
Figure 3
Figure 3
Voxel-based analysis of group difference between CN and MCI. From left to right, group comparison results on GM, WM, and CSF are shown. (GM: CN>MCI, p<0.05, FDR-corrected; CSF: MCI>CN, p<0.05, FDR-corrected; WM:CN>MCI, p<0.001, uncorrected). The color-maps indicate the scale for the t-statistic. Images are displayed in radiological convention.
Figure 4
Figure 4
Voxel-based analysis of group difference between MCI and AD. Left column shows GM comparisons, and middle column shows WM comparisons, without correction of multiple comparisons (MCI>AD, p<0.001, uncorrected). After FDR correction (MCI>AD, p<0.05), significant group differences are found only in GM RAVENS maps, as shown in right column. No significant group difference was found on CSF comparisons. The color-maps indicate the scale for the t-statistic. Images are displayed in radiological convention.
Figure 5
Figure 5
ROC curves showing the overall classification performance in MRI-based classification of AD from CN, MCI from CN, and AD from MCI. Their respective AUCs (area under the ROC curve) are 0.965, 0.846, and 0.759.
Figure 6
Figure 6
Histograms of the MRI-based classification scores for MCI subjects obtained via applying the classifiers built on AD and CN participants. 57 out of 88 MCI subjects display positive scores, i.e. their MRI scans indicate that they possess the structural pattern characteristic of AD.
Figure 7
Figure 7
Voxel-based analysis of group differences between MCI_CN and MCI_AD. From left to right, group comparison results on GM, WM, and CSF are shown. (GM, WM: MCI_CN>MCI_AD, CSF: MCI_AD > MCI_CN, p<0.05, corrected). The color-maps indicate the scale for the t-statistic. Images are displayed in radiological convention.
Figure 8
Figure 8
Voxel-based analysis of group difference between CN and MCI_ AD. From left to right, group comparison results on GM, WM, and CSF are shown. (GM, WM: CN>MCI_AD, CSF: MCI_AD>CN, p<0.05, corrected). The color-maps indicate the scale for the t-statistic. Images are displayed in radiological convention.
Figure 9
Figure 9
Voxel-based analysis of group difference between MCI_CN and AD. From left to right, group comparison results on GM, WM, and CSF are shown. (GM, WM: MCI_CN >AD, CSF: AD> MCI_CN, p<0.05, corrected). The color-maps indicate the scale for the t-statistic. Images are displayed in radiological convention.
Figure 10
Figure 10
The distributions of the MMSE scores during baseline and follow-ups of MCI subgroups.
Fig. 11
Fig. 11
Regression plot of the rates of MMSE change and the SPS scores at baseline.
Fig. 12
Fig. 12
Classification rates and areas under the ROC curve obtained by subgrouping MCI patients into progressors and non-progressors, according to a threshold on their rates of MMSE change within a year. Optimal classification rate of 0.87=87% (AUC 0.86) was obtained for a threshold around -1, i.e. if one defines progressors as the MCI patients that display rates of change of MMSE score < -1/year. This is in agreement with the fact that even CN individuals display some rate of decline. The red curve is a histogram of the rate of MMSE change, the blue stars are individual MCI patients, and the numbers before and after comma within parentheses are the correct classification rates and the AUCs.

References

    1. Adeli H, Ghosh-Dastidar S, Dadmehr N. Alzheimer’s disease and models of computation: imaging, classification, and neural models. Journal of Alzheimer’s Disease. 2005;7:187–199. - PubMed
    1. Ashburner J, Csernansky JG, Davatzikos C, Fox NC, Frisoni GB, Thompson PM. Computer-assisted imaging to assess brain structure in healthy and diseased brains. The Lancet (Neurology) 2003;2:79–88. - PubMed
    1. Bennett SAL, Pappas BA, Stevens WD, Davidson CM, Fortin T, Chen J. Cleavage of amyloid precursor protein elicited by chronic cerebral hypoperfusion. Neurobiology of Aging. 2000;21:207–214. - PubMed
    1. Beresford T, Arciniegas D, Alfers J, Clapp L, Martin B, Beresford H, Du Y, Liu D, Shen D, Davatzikos C, Laudenslager M. Hypercortisolism In Alcohol Dependence and Its Relation to Hippocampal Volume Loss. Journal of Studies on Alcohol. 2006;67:861–867. - PubMed
    1. Beresford TP, Arciniegas DB, Alfers J, Clapp L, Martin B, Du Y, Liu D, Shen D, Davatzikos C. Hippocampus Volume Loss Due to Chronic Heavy Drinking. Alcoholism: Clinical and Experimental Research. 2006;30:1866–1870. - PubMed

Publication types

MeSH terms

LinkOut - more resources