

Multi-modality study of the compositional and mechanical implications of hypomineralization in a rabbit model of osteomalacia
- PMID: 18053788
- PMCID: PMC2259120
- DOI: 10.1016/j.bone.2007.10.011
Multi-modality study of the compositional and mechanical implications of hypomineralization in a rabbit model of osteomalacia
Abstract
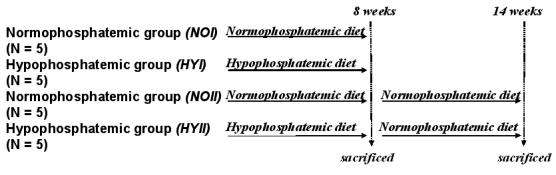
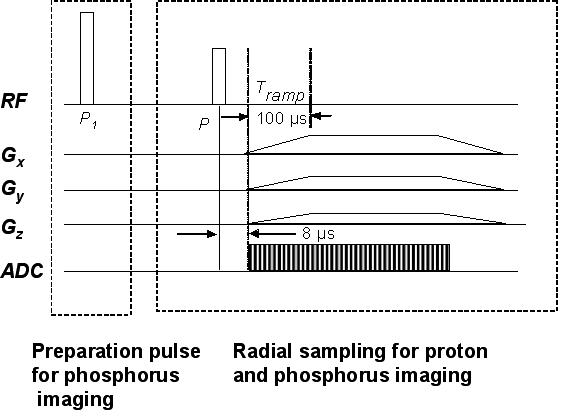
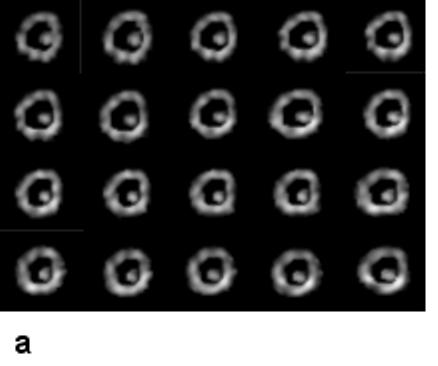
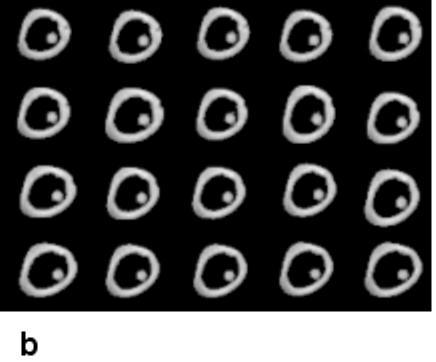
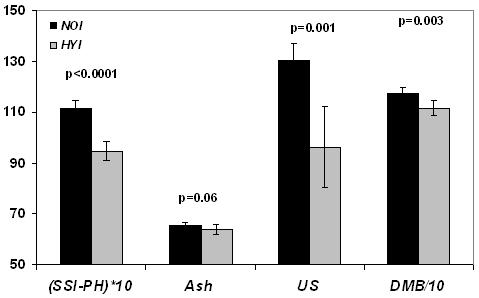
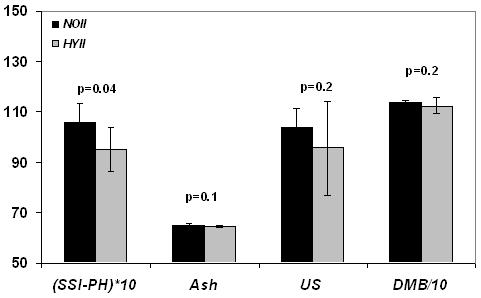
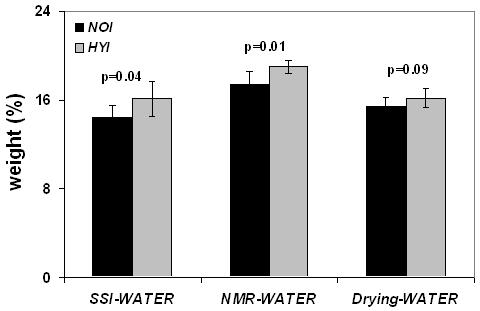
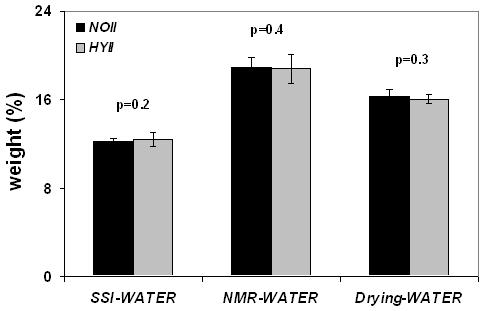
Osteomalacia is characterized by hypomineralization of the bone associated with increased water content. In this work we evaluate the hypotheses that 1) 3D solid-state magnetic resonance imaging (MRI) of (31)P (SSI-PH) and (1)H (SSI-WATER) of cortical bone can quantify the key characteristics of osteomalacia induced by low-phosphate diet; and 2) return to normophosphatemic diet (NO) results in recovery of these indices to normal levels. Twenty female five-week old rabbits were divided into four groups. Five animals were fed a normal diet for 8 weeks (NOI); five a hypophosphatemic diet (0.09%) for the same period to induce osteomalacia (HYI). To examine the effect of recovery from hypophosphatemia an additional five animals received a hypophosphatemic diet for 8 weeks, after which they were returned to a normal diet for 6 weeks (HYII). Finally, five animals received a normal diet for the entire 14 weeks (NOII). The NOI and HYI animals were sacrificed after 8 weeks, the NOII and HYII groups after 14 weeks. Cortical bone was extracted from the left and right tibiae of all the animals. Water content was measured by SSI-WATER and by a previously reported spectroscopic proton-deuteron nuclear magnetic resonance (NMR) exchange technique (NMR-WATER), phosphorus content by SSI-PH. All MRI and NMR experiments were performed on a 9.4 T spectroscopy/micro-imaging system. Degree of mineralization of bone (DMB) was measured by micro-CT and elastic modulus and ultimate strength by 3-point bending. The following parameters were lower in the hypophosphatemic group: phosphorus content measured by SSI-PH (9.5+/-0.4 versus 11.1+/-0.3 wt.%, p<0.0001), ash content (63.9+/-1.7 versus 65.4+/-1.1 wt.%, p=0.05), ultimate strength, (96.3+/-16.0 versus 130.7+/-6.4 N/mm(2), p=0.001), and DMB (1115+/-28 versus 1176+/-24 mg/cm(3), p=0.003); SSI-WATER: 16.1+/-1.5 versus 14.4+/-1.1 wt.%, p=0.04; NMR-WATER: 19.0+/-0.6 versus 17.4+/-1.2 wt.%, p=0.01. Return to a normophosphatemic diet reduced or eliminated these differences (SSI-PH: 9.5+/-0.9 versus 10.6+/-0.8 wt.%, p=0.04; DMB: 1124+/-31 versus 1137+/-10 mg/cm(3), p=0.2; US: 95.6+/-18.6 versus 103.9+/-7.5 N/mm(2), p=0.2; SSI-WATER: 12.4+/-0.6 versus 12.2+/-0.3 wt.%, p=0.3) indicating recovery of the mineral density close to normal levels. Phosphorus content measured by SSI-PH was significantly correlated with DMB measured by micro-CT (r(2)=0.47, p=0.001) as well as with ultimate strength (r(2)=0.54, p=0.0004). The results show that the methods presented have potential for in situ assessment of mineralization and water, both critical to the bone's mechanical behavior.
Figures
Similar articles
-
Water content measured by proton-deuteron exchange NMR predicts bone mineral density and mechanical properties.J Bone Miner Res. 2004 Feb;19(2):289-96. doi: 10.1359/JBMR.0301227. Epub 2003 Dec 16. J Bone Miner Res. 2004. PMID: 14969399
-
Measurement of phosphorus content in normal and osteomalacic rabbit bone by solid-state 3D radial imaging.Magn Reson Med. 2006 Nov;56(5):946-52. doi: 10.1002/mrm.21050. Magn Reson Med. 2006. PMID: 17041893
-
Ultra-short echo-time MRI detects changes in bone mineralization and water content in OVX rat bone in response to alendronate treatment.Bone. 2010 May;46(5):1391-9. doi: 10.1016/j.bone.2010.01.372. Epub 2010 Jan 21. Bone. 2010. PMID: 20096815 Free PMC article.
-
Hypophosphatemic osteomalacia induced by low-dose adefovir therapy: focus on manifestations in the skeletal system and literature review.J Bone Miner Metab. 2013 Mar;31(2):240-6. doi: 10.1007/s00774-012-0384-y. Epub 2012 Sep 14. J Bone Miner Metab. 2013. PMID: 22976054 Review.
-
Phosphate depletion syndrome: case report with bone and muscle histology findings and review of the literature.JPEN J Parenter Enteral Nutr. 1988 May-Jun;12(3):313-7. doi: 10.1177/0148607188012003313. JPEN J Parenter Enteral Nutr. 1988. PMID: 3292800 Review.
Cited by
-
31P NMR relaxation of cortical bone mineral at multiple magnetic field strengths and levels of demineralization.NMR Biomed. 2013 Sep;26(9):1158-66. doi: 10.1002/nbm.2930. Epub 2013 Mar 18. NMR Biomed. 2013. PMID: 23505120 Free PMC article.
-
Cortical bone water: in vivo quantification with ultrashort echo-time MR imaging.Radiology. 2008 Sep;248(3):824-33. doi: 10.1148/radiol.2482071995. Epub 2008 Jul 15. Radiology. 2008. PMID: 18632530 Free PMC article.
-
Computational biomechanics of the distal tibia from high-resolution MR and micro-CT images.Bone. 2010 Sep;47(3):556-63. doi: 10.1016/j.bone.2010.05.039. Epub 2010 May 31. Bone. 2010. PMID: 20685323 Free PMC article.
-
Solid-State Quantitative (1)H and (31)P MRI of Cortical Bone in Humans.Curr Osteoporos Rep. 2016 Jun;14(3):77-86. doi: 10.1007/s11914-016-0307-2. Curr Osteoporos Rep. 2016. PMID: 27048472 Free PMC article. Review.
-
Quantitative (31)P NMR spectroscopy and (1)H MRI measurements of bone mineral and matrix density differentiate metabolic bone diseases in rat models.Bone. 2010 Jun;46(6):1582-90. doi: 10.1016/j.bone.2010.02.020. Epub 2010 Feb 24. Bone. 2010. PMID: 20188225 Free PMC article.
References
-
- Grynpas M. Age and disease-related changes in the mineral of bone. Calcif Tissue Int. 1993;53(Suppl 1):S57–64. - PubMed
-
- Hammett FS. A biochemical study of bone growth. I. Changes in the Ash, Organic matter and Water during growth. J Biol Chem. 1925;64:409–428.
-
- Elliott SR, Robinson RA. The water content of bone. I. The mass of water, inorganic crystals, organic matrix, and CO2 space components in a unit volume of the dog bone. J Bone Joint Surg Am. 1957;39-A:167–88. - PubMed
-
- Robinson RA. Chemical analysis and electron microscopy of bone. In: Rodahl K, Nicholson JT, Brown EM, editors. Bone as a Tissue. McGraw-Hill book Company; New York: 1960. p. 186.
-
- Neuman WF, Neuman MW. The Chemical Dynamics of Bone Mineral. University of Chicago Press, IL; Chicago: 1958. Skeletal Dynamics; p. 101.
Publication types
MeSH terms
Grants and funding
LinkOut - more resources
Full Text Sources
Medical
Research Materials
Miscellaneous
