Clinical Trial
. 2007 Dec;47(28):3409-23.
doi: 10.1016/j.visres.2007.09.020.

Testing limits on matte surface color perception in three-dimensional scenes with complex light fields

Affiliations
Clinical Trial

Testing limits on matte surface color perception in three-dimensional scenes with complex light fields

K Doerschner et al. Vision Res. 2007 Dec.

Abstract

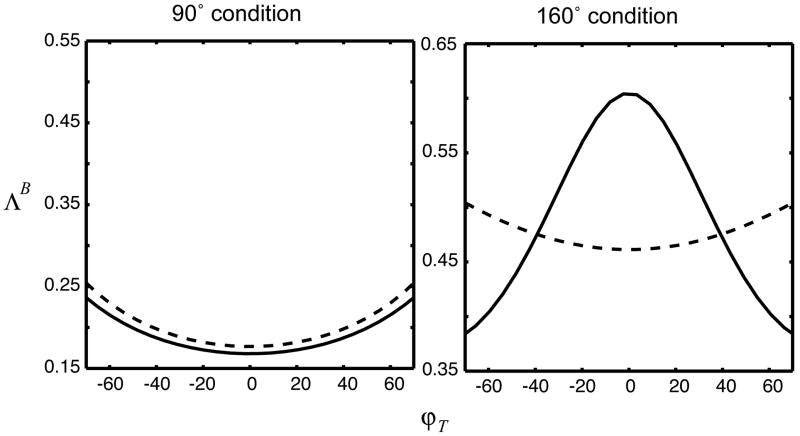
We investigated limits on the human visual system's ability to discount directional variation in complex lights field when estimating Lambertian surface color. Directional variation in the light field was represented in the frequency domain using spherical harmonics. The bidirectional reflectance distribution function of a Lambertian surface acts as a low-pass filter on directional variation in the light field. Consequently, the visual system needs to discount only the low-pass component of the incident light corresponding to the first nine terms of a spherical harmonics expansion [Basri, R., Jacobs, D. (2001). Lambertian reflectance and linear subspaces. In: International Conference on Computer Vision II, pp. 383-390; Ramamoorthi, R., Hanrahan, P., (2001). An efficient representation for irradiance environment maps. SIGGRAPH 01. New York: ACM Press, pp. 497-500] to accurately estimate surface color. We test experimentally whether the visual system discounts directional variation in the light field up to this physical limit. Our results are consistent with the claim that the visual system can compensate for all of the complexity in the light field that affects the appearance of Lambertian surfaces.


Figures

Figure 1
Figure 1. Illustration of the light field
A. A light field, ϕ denotes azimuth, θ denotes elevation. B. An ‘unwrapped’ version where azimuth and elevation now correspond to horizontal and vertical axes respectively. The environment map for this illustration was obtained from http://www.debevec.org/Probes.
Figure 2
Figure 2. Light field directional structure and surface appearance
Images were rendered with Radiance (Ward, 1994). A. A mirror sphere (left) and matte sphere (right) were rendered using the same light probe (http://www.debevec.org/Probes). B. We low-pass filtered the light probe, removing fine spatial detail. Under this illumination the mirror sphere ceases to look chrome-like and changes its appearance to that of a brushed metal. The matte sphere however does not change in appearance. In the text we explain why. C. A was subtracted from B. The values of the resultant difference image were squared, and are shown in reddish hues. Gray indicates zero difference.
Figure 3
Figure 3. The 4D and 9D spherical harmonics subspaces
Shown are the first nine spherical harmonics basis functions in spherical coordinates. Since they reside on the sphere, the dimensions of these basis functions are π × 2π (elevation × azimuth). Middle gray denotes zero, white are positive, and black are negative values. Vertical axes correspond to the elevation in the range [0 π], horizontal axes correspond to azimuth in the range [−π π]. When approximating an arbitrary light field with the 1st order harmonics (or the 4D subspace: Y0,0, Y1,−1, Y1,0, Y1,1), one can have at most one maximum of intensity (one –bump) in the expansion. If a light field is approximated with 2nd order harmonics (or the 9D subspace: Y0,0, Y1,−1, Y1,0, Y1,1, Y2,−2, Y2,−1, Y2,0, Y2,1, Y2,2), two (sufficiently distant from each other) maxima of intensity in the light field can be detected in the expansion.
Figure 4
Figure 4. Example of a stereo pair of stimuli (for crossed and uncrossed fusion)
Stimuli were computer-generated scenes each composed of a matte ground plane and a number of objects of various shapes, sizes, and reflectance properties. Scenes contained a Lambertian, rectangular test patch at the center. Observers viewed stimuli in a computer-controlled stereoscope.
Figure 5
Figure 5. Example of scenes under the 90° (left) and 160° (right) illumination conditions
Only the left image of each stereo pair is shown. Scenes are illuminated by a composition of a diffuse blue source and two yellow punctate sources either 90° apart (left), or 160° apart (right).
Figure 6
Figure 6. Lighting and test surface coordinates
A. Lighting coordinates. Scenes in both experiments were illuminated by a mixture of two yellow punctate sources (P1, P2) and one diffuse blue light. The azimuth and elevation of the yellow sources were denoted by θi and ϕi(i = 1,2) respectively. At ϕi = 0° lies the line of sight of the observer. The punctate source was placed sufficiently far (d = 665cm) from the test patch so that it was effectively a collimated source. Its elevation was θI = 65° and never varied throughout the experiment. B. Test surface coordinates. The azimuth of the test patch was denoted ϕT (ϕT = 0° corresponds to the line of sight of the observer, i.e. the test patch surface normal would be pointing directly towards the observer). The patch was simulated to approximately 70 cm away from the observer, and its azimuth (ϕT) could take on one out of nine orientations {− 65° −45° −25° −10° 0° 25° 45° 65°}. The elevation of the test patch π/2 was never varied throughout the experiment.
Figure 7
Figure 7. Predictions of relative blue in the 90° and 160° illumination condition, for a 4D and 9D subspace expansion of the lighting model
Shown are the predictions of relative blue settings (ΛB) as a function of test patch orientation (ϕT) for both illumination conditions (left 90°, right 160°). Graphs depict ΛB of an ideal observer discounting the directional variation in the illumination up to a 4D subspace (dashed line) or a 9D subspace (solid line).
Figure 8
Figure 8. Data & fits for relative blue, 9D vs 4D lighting model expansion, 160°-condition
We plot ΛB as a function of test patch orientation ϕT. The figure shows observers’ data (diamond symbols, error bars are ±2SE of the mean, which corresponds approximately to the 95% confidence interval). The figure illustrates clearly that the data is fit better when an observer’s EIM is approximated with a 9D spherical harmonic subspace (solid line) than with a 4D harmonic subspace (dashed line), indicating that the visual system can resolve at least directional variation in the illumination up to a 9D subspace. All fits are obtained by means of maximum likelihood estimation as described in the text.
Figure 9
Figure 9. Data & fits for relative blue 90°-condition
Symbols and SE are defined as in Figure 9. ΛB is plotted as a function of test patch orientation ϕT. We found no evidence in support of this possibility – for all observers the shape of ΛB in the 160°-, and 90°-condition differs clearly. Note that the 4D and 9D curve fits for this condition are virtually indistinguishable.
Figure 10
Figure 10. 4D and 9D harmonic expansion of LP
Illustrated is the expansion of LP for one channel coding channel activity on a black-white scale shown next to each expansion. If P1 and P2 are placed sufficiently far from each other, as in the 160°-condition in the 9D expansion of LP will have two maxima of intensity. Conversely, if P1 and P2 are located closer together, as in the 90°-condition, 4D and 9D spherical harmonic expansion of LP will both have only one maximum of intensity.

References

    1. Adelson E, Bergen J. The plenoptic function and elements of early vision. In: Landy MS, Movshon AJ, editors. Computational models of visual processing. Cambridge: MIT Press; 1991. pp. 3–20.
    1. Adelson EH. On seeing stuff: The perception of materials by humans and machines. In: Rogowitz BE, Pappas TN, editors. Proceedings of the SPIE Vol 4299. Human Vision and Electronic Imaging. VI. 2001. pp. 1–12.
    1. Arfken G. In Mathematical methods for physicists. 3. Orlando: Academic Press; 1985a. Spherical harmonics; pp. 680–685.
    1. Arfken G. mathematical methods for physicists. 3. Orlando: Academic Press; 1985b. Integrals of the products of three spherical harmonics; pp. 698–700.
    1. Basri R, Jacobs D. Lambertian reflectance and linear subspaces. International Conference on Computer Vision II; 2001. pp. 383–390.

Publication types