Comparative Study
. 2008 Jan 25;375(4):920-33.
doi: 10.1016/j.jmb.2007.10.087. Epub 2007 Nov 9.

Probing protein fold space with a simplified model

Affiliations
Comparative Study

Probing protein fold space with a simplified model

Peter Minary et al. J Mol Biol. .

Abstract

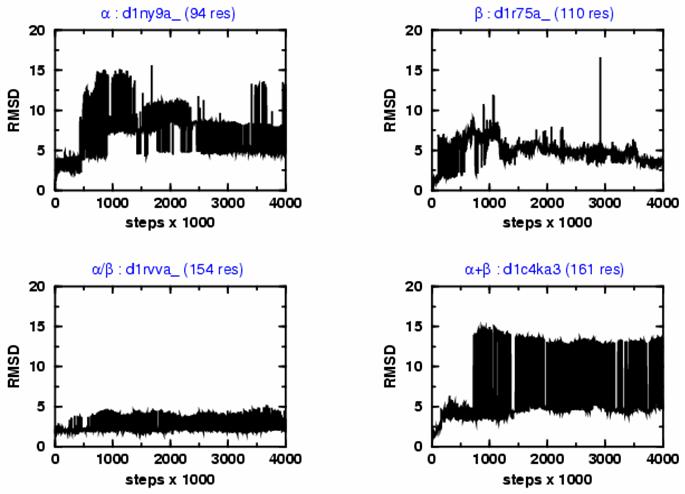
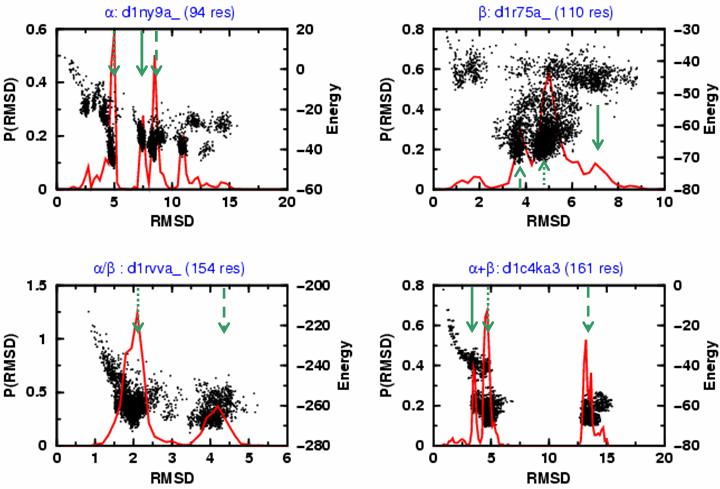
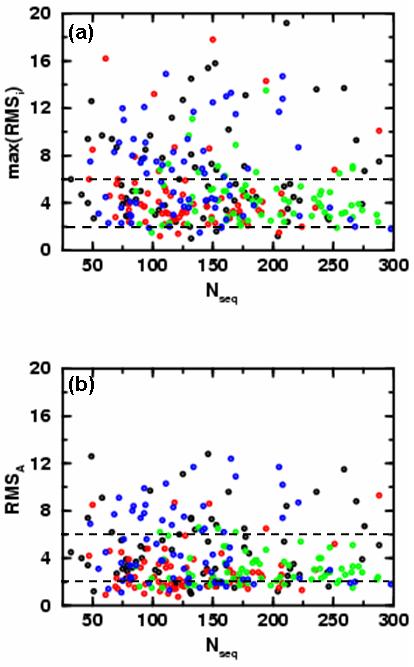
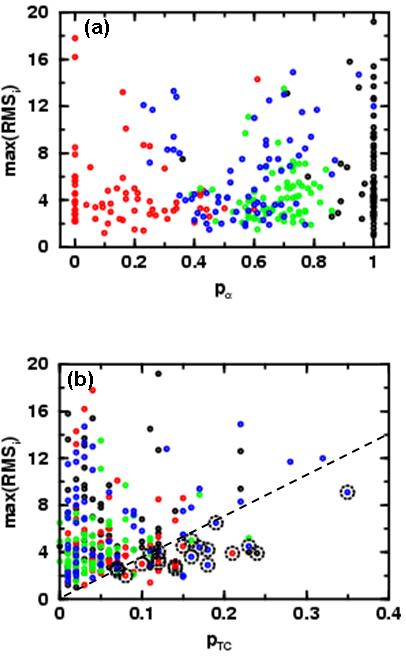
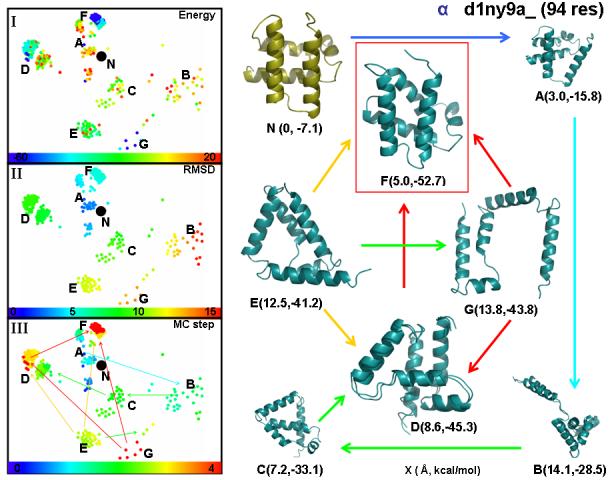
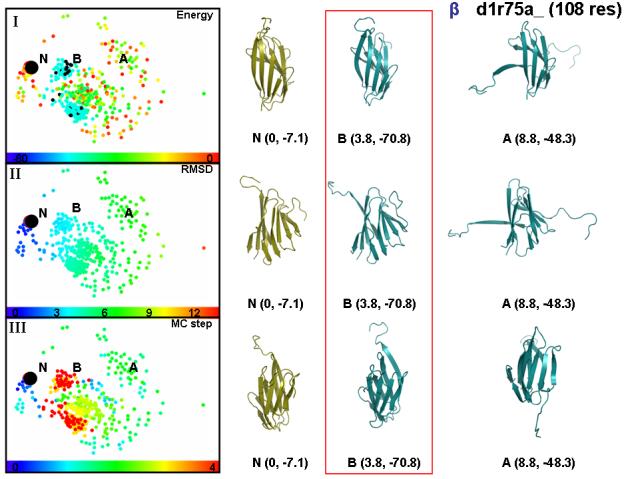
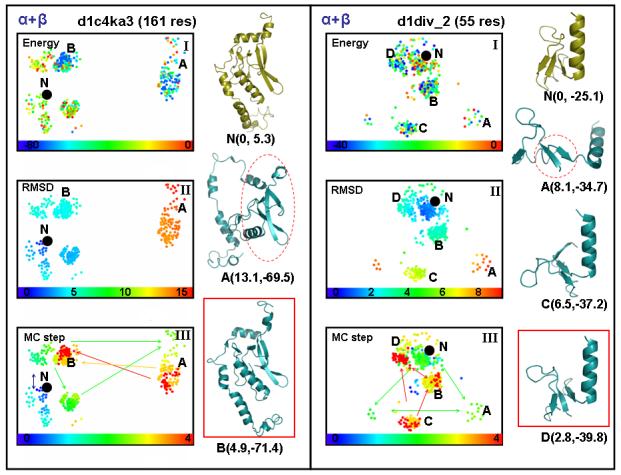
We probe the stability and near-native energy landscape of protein fold space using powerful conformational sampling methods together with simple reduced models and statistical potentials. Fold space is represented by a set of 280 protein domains spanning all topological classes and having a wide range of lengths (33-300 residues) amino acid composition and number of secondary structural elements. The degrees of freedom are taken as the loop torsion angles. This choice preserves the native secondary structure but allows the tertiary structure to change. The proteins are represented by three-point per residue, three-dimensional models with statistical potentials derived from a knowledge-based study of known protein structures. When this space is sampled by a combination of parallel tempering and equi-energy Monte Carlo, we find that the three-point model captures the known stability of protein native structures with stable energy basins that are near-native (all alpha: 4.77 A, all beta: 2.93 A, alpha/beta: 3.09 A, alpha+beta: 4.89 A on average and within 6 A for 71.41%, 92.85%, 94.29% and 64.28% for all-alpha, all-beta, alpha/beta and alpha+beta, classes, respectively). Denatured structures also occur and these have interesting structural properties that shed light on the different landscape characteristics of alpha and beta folds. We find that alpha/beta proteins with alternating alpha and beta segments (such as the beta-barrel) are more stable than proteins in other fold classes.


Figures

Figure 1a
Figure 1a
Showing the variation of the root mean square deviation of all Cα atoms (RMSD) from the native structure with the number of Monte Carlo iteration steps for four SCOP protein domains representing the four major structure classes: α (d1ny9a_), β (d1r75a_), α/β (d1rvva_), and α+β (d1c4ka3). Domains are described with the 3-point per residue model. All trajectories started from the crystal structures and were propagated for a total of 4,000,000 steps using an advanced combination of Parallel Tempering and Equi-Energy Monte Carlo methods. The simulation explore the conformational space around the native structure with rapid and frequent transitions between states that have very different RMSD values; at the end of the trajectories, the RMSD generally reaches values lower than 5 Å.
Figure 1b
Figure 1b
The distribution of RMSD values from native distribution (solid red curve) is plotted together with the energy values obtained for sampled conformations (black dots) for d1ny9a_, d1r75a_, d1rvva_ and d1c4ka3, the same protein folds shown in Fig. 1a. The green arrows indicate the locations of: (1) the most probable RMSD value (denoted RMSA and marked with a dotted green arrow); (2) the second most probable RMSD value (denoted RMSB, dashed green arrow); and (3) the third most probable RMSD value (denoted RMSC, solid green arrow). In many cases, there is a clear separation of clusters of conformations based on their energy and RMSD values (d1r75a_, an all-β fold is an exception). The most probable cluster is often the closest to the native structure (i.e. RMSA is smaller than RMSB or RMSC).
Figure 2
Figure 2
Showing the variation of the basin RMSD from crystal structure with the size of protein, (Nseq). We show the results for all 280 domains studied here: domains from α, β, α/β and α+β topological classes are colored black, red, green and blue, respectively. Here we consider the three most probable basins for each protein, RMSA, RMSB and RMSC (see Fig. 1b). In (a) we show the RMSD value of the least native-like of the top three dominant energy basins (max(RMSA,RMSB,RMSC)) as a function of the number of residues. One third of the domains (88 out of 280, 31.4 %) have RMSD values above 6 Å (dashed black horizontal line). On average α/β and β domains remain closer to the native state than other classes of domains. Only 4.29 % of proteins have RMSD values below 2 Å (dashed black horizontal line). 90 % of all-α, all-β, α/β and α+β class domains are below thresholds of 12.7 Å, 8.5 Å, 6.9 Å and 12.0 Å, respectively. In (b) we show the RMSD value of the most dominant energy basin (RMSA) as a function of the number of residues. In this case, only 19.3 % (54 out of 280) of the domains have RMSD values above 6 Å (dashed black horizontal line) and almost all (66 out of 70 or 94.3 %) α/β domains are below the 6 Å line. 90 % of all-α, all-β, α/β and α+β class domains are below thresholds of 9.1 Å, 4.8 Å, 5.0 Å and 9.2 Å, respectively.
Figure 3
Figure 3
In (a) we show the variation of RSMD value of the least native-like of the top three dominant energy basins (max(RMSi)) for all 280 protein folds as a function of the alpha content, defined as pα = nα/(nα+nβ), where there are nα residues in α-helix and nβ in β-sheet. In medium alpha content (0.4 < pα < 0.6), most domains have cRMS values below 6.0 Å (there are only four exceptions). In (b) we show how the max(RMSi)) varies with the fractional terminal coil residue content, pTC (given by nTC/nseq, where nTC is the number of residues before the first or after the last segment of α or β secondary structure). 259 out of the 280, (92.5 %) domains have few unstructured terminal residues (pTC smaller than 0.15). In addition, as pTC increases, so does the minimum RMSD of the most denatured basin from the native structure. Exceptions to this rule are found below the dashed guide line given by max(RMSi)=15/0.4 pTC and marked with a black dotted circle if they have lower than 50 % α and/or β content. Among the exceptions only 8 domains with high α and/or β content were found. Proteins from α, β, α/β and α+β topological classes are colored black, red, green and blue respectively.
Figure 4
Figure 4
showing a two-dimensional projection of the high-dimensional conformational space of a typical all-α fold trajectory (d1ny9a_) in which the dots mark the positions of each structure as a function of x and y measured in Ångstroms. The projection was generated by using the open-source program GRAPHVIZ with an all-to-all RMSD distance matrix derived from 400 structures sampled every 10,000th steps along the trajectory. The native conformation is marked with N and various clusters of similar conformations are marked by letters from A to G. In panel (I), conformations are colored by their energy. We ensure uniform use of all colors by sorting the structures by the energy and linearly mapping the rank of each structure on the color scale (the minimum and maximum energy values are indicated). In panel (II), conformations are colored by their RMSD distance from the native structure; the clear progression from blue to red in each of the four directions (up, down, right, left) as points are further from the native conformation verifies the accuracy of our dimensional reduction. In panel (III), conformations are colored by the step number along the sampling trajectory. Since the most significant fraction of the trajectory and are located in some smaller clusters, a normalized square color-bar-timestep mapping is used in order to avoid the accumulation of multiple colors in narrow clusters. The latter non-linear monotonic scaling improves visualization of the progress along the trajectory. The single headed arrows between clusters point towards the lower energy cluster. In the right-hand panel, we show snapshots of typical conformations that represent the clusters shown in panels (I), (II) and (III). For each molecular structure we show in parenthesis the RMSD from native in Å and the total energy in kcal/mol. The conformation with the lowest energy (see (F)) is enclosed in a red box.
Figure 5
Figure 5
showing the same type of two-dimensional projection of conformational space used in Fig. 4 for a typical all-β fold trajectory (d1r75a_). In this case, conformational space has a more diffuse character. We demarcate by the letters N, A and B three regions of the conformational space representing the near-native states, the first quarter of the run and the final sixth of the trajectory. The left-hand panels, which are like those in Fig. 4, show how the conformation has a high energy at first and moves though much of the space before settling down close to the native structure in lowest energy basin B. The lowest energy conformation of the whole trajectory belongs to basin B and then a conformation for basin A is chosen as the lowest energy conformation among the top 2.5 % most denatured ones. The conformations associated with each basin and the native is shown in three different orientations to facilitate comparison to the native state. Each snapshots is shown with its RMSD values in Å and their total energy in kcal/mol.
Figure 6
Figure 6
showing the same two-dimensional projection of conformational space used in Fig. 4 but now for two α + β domains, d1c4ka3, which has 161 residues, and d1div_2, which is much smaller with 55 residues. In the case of d1c4ka3, the two major conformational clusters are marked by A and B according to the order they were visited. The MC step subplot in panel (III) shows how the initially visited conformations (green nodes) transforms into orange and then finally red exploration paths (the single headed arrows between clusters point towards lower energy ones, the double headed arrows between clusters indicate their similar energy). The snapshots of the conformations show that the sampling path passes through a very unfolded state (basin A) before locating a near-native, low-energy conformation in basin B (framed in red). In the case of d1div_2, there are four major conformational clusters denoted A to D in the order visited. The representative conformations for each cluster are depicted. The snapshots of the conformations show that the simulation passes through very unfolded states (basins A and C) before locating an near-native, low-energy conformation in basin D (framed in red).

Similar articles

Cited by

References

    1. Ponting C, Russell R. The natural history of protein domains. Annu. Rev. Biophys. Biomol. Struct. 2002;31:45–71. - PubMed
    1. Murzin AG, Brenner SE, Hubbard T, Chothia C. SCOP:a structural classification of proteins database for the investigation of sequences and structures. J. Mol. Biol. 1995;247:536–540. - PubMed
    1. Orengo CA, Michie AD, Jones S, Jones DT, Swindels MB, Thornton JM. CATH: a hierarchic classification of protein domain structures. Structure. 1997;5:1093–1108. - PubMed
    1. Holm L, Sander C. Mapping the Protein Universe. Science. 1996;273:595–602. - PubMed
    1. Levitt M, Chothia C. Structural Patterns in Globular Proteins. Nature. 1976;261:552–558. - PubMed

Publication types

LinkOut - more resources