

Review
doi: 10.1016/j.neuron.2007.11.008.
Inhibition and brain work
Affiliations
- PMID: 18054855
- PMCID: PMC2266612
- DOI: 10.1016/j.neuron.2007.11.008
Item in Clipboard
Review
Inhibition and brain work
Neuron.
.
Abstract
The major part of the brain's energy budget ( approximately 60%-80%) is devoted to its communication activities. While inhibition is critical to brain function, relatively little attention has been paid to its metabolic costs. Understanding how inhibitory interneurons contribute to brain energy consumption (brain work) is not only of interest in understanding a fundamental aspect of brain function but also in understanding functional brain imaging techniques which rely on measurements related to blood flow and metabolism. Herein we examine issues relevant to an assessment of the work performed by inhibitory interneurons in the service of brain function.
Figures
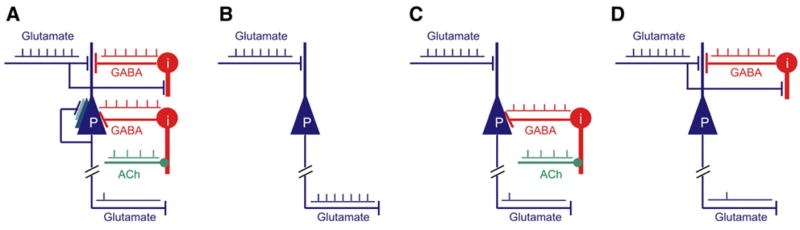
Both “spontaneous” ongoing (intrinsic) activity (A), which accounts for the largest fraction of the brain’s energy budget, and evoked activity are a combination of excitation (glutamate) and inhibition (GABA). (B) In the simplest (but nonrealistic) example of a change in activity resulting from an increase in glutamate release unopposed by a change in GABA, EPSPs and spike output are well correlated and accompanied by an increase in energy consumption. However, parallel changes in GABA and glutamate induce nonlinear responses in the system. For example, in the presence of an increase in somatic feed-forward inhibition (C) produced by subcortical neurotransmitters (e.g., acetylcholine [Ach]) the same increase in glutamate release produces the same EPSPs as in (B), but the spike output of the principal cell is decreased. The local energy consumption increases as in (B) despite the fact that the output of the principal cell has not changed. An imaging method detecting only glutamate release-related metabolic activity cannot distinguish between (B) and (C) despite the difference in local computation and spike output. (D) In the presence of dendritic inhibition (D), the quantity of glutamate released locally may be even greater than in (B) or (C), yet the output of the principal cell, in this hypothetical case, is the same as in (C). Energy consumption related to the generation of EPSPs and the processing of glutamate by astrocytes would clearly increase, possibly more than in (B) or (C). These examples serve to illustrate the dependence of brain imaging signals on the energy demanding events associated with the input to both principal cells and interneurons. They also serve to alert researchers to the potential complexity of comparing the output of principal cells (spikes) to changes in brain imaging signals.
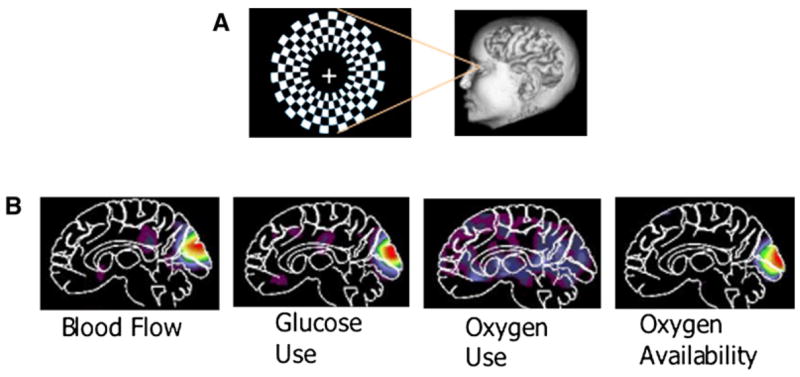
An increase in brain activity involves an increase in blood flow and glucose use, as illustrated when the visual system is stimulated with a reversing annular checkerboard (A) (data adapted from Fox et al., 1988). The degree to which oxygen use increases is variable but always less than the increase in glucose utilization and blood flow. The fMRI BOLD signal emerges as a marker of brain activity because of the resulting increase in oxygen availability and hemoglobin oxygenation, which has a direct effect on the MRI magnet field (Ogawa et al., 1990). If circumstances of increased activity involved equal increases in oxygen consumption, glucose utilization, and blood flow then measurements of glucose utilization with 2-deoxyglucose would reveal a change but the fMRI BOLD signal would not (B). Is it possible that an increase in excitatory neurotransmission involves increases in blood and glucose utilization that are greater than the increase in oxygen consumption but with an increase in inhibitory neurotransmission the three move in parallel? To date, the lack of rigorous experiments prevents one from answering this question.
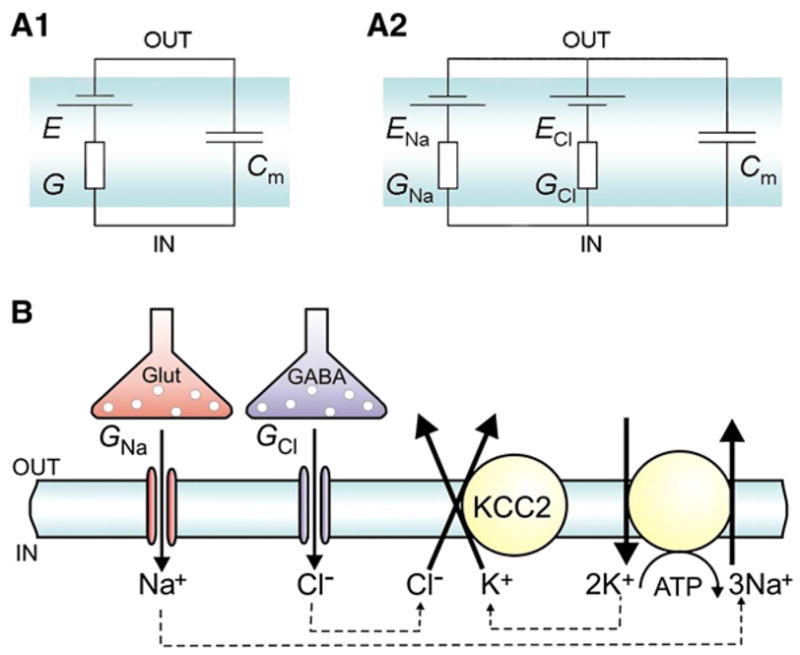
(A1) When channels that are permeable for a single ion species only are activated (depicted as conductance, G), the current that is needed to charge the membrane capacitance Cm to the equilibrium potential of this ion (E) is negligible. Hence, the net ion flux across the membrane is very small. (A2) During coactive excitation and inhibition, glutamate-and GABA-gated ion channels (GNa and GCl, respectively) are activated. A simultaneous influx of the oppositely charged Na+ and Cl− ions, driven by the ionic electrochemical gradients (Vm−ENa and Vm−ECl), takes place. Therefore, most of the net influx of the Na+ and Cl− ions is electrically neutral (see Equation 1). (B) Simplified scheme depicting channel and transporter mediated ionic fluxes at excitatory and inhibitory synapses, where the net influx of Cl− and Na+ ions across glutamate- and GABA-gated ion channels is counteracted by the K-Cl cotransporter KCC2 (or some other KCC isoform) and by the Na-K ATPase. K+ accumulation by the Na-K AT-Pase leads typically to values of EK of about −100 mV, which is a fundamental requirement for hyperpolarizing GABAergic inhibition: the K+ electrochemical gradient sets the driving force for Cl− extrusion by KCC2. Because the Na-K ATPase takes up two K+ ions for one cycle of ATP hydrolysis, two Cl− ions are extruded at the expense of one ATP. Hence, one cycle of the Na-K pump that consumes one ATP molecule can offset the influx of two Cl− ions and three Na+ ions. “Out” and “in” refer to the extracellular and intracellular compartments, respectively. In (A2), the Hodgkin-Huxley convention of setting the polarities of ENa and ECl was adopted.
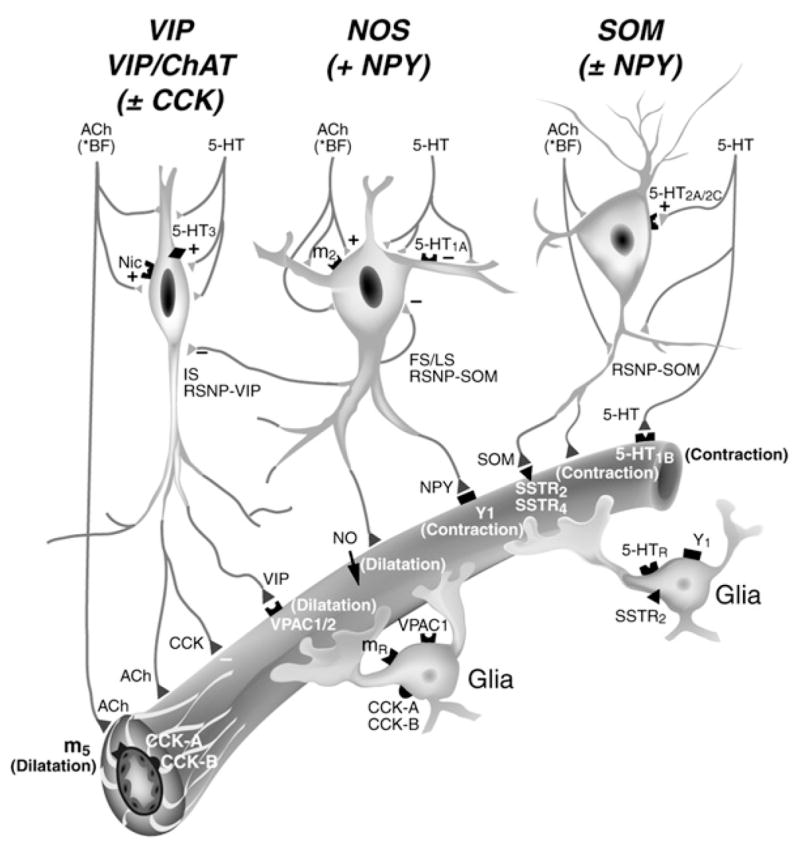
Their direct vasomotor effects are thought to be mediated by m5 muscarinic ACh receptor (dilatation) or 5-HT1B receptor (constriction). Local microvessels are endowed with subtype-specific receptors for vasoactive neuropeptides (VIP, NPY, or SOM) and NO (not shown) coreleased from GABAergic interneurons. Reprinted with permission from Cauli et al. (2004), copyright 2004 by the Society for Neuroscience.
References
-
- Ames A., III CNS energy metabolism as related to function. Brain Res Brain Res Rev. 2000;34:42–68. - PubMed
-
- Attwell D, Laughlin SB. An energy budget for signaling in the grey matter of the brain. J Cereb Blood Flow Metab. 2001;21:1133–1145. - PubMed
-
- Attwell D, Gibb A. Neuroenergetics and the kinetic design of excitatory synapses. Nat Rev Neurosci. 2005;6:841–849. - PubMed
Publication types
MeSH terms
Substances
Grants and funding
LinkOut - more resources
Full Text Sources
