. 2007 Dec 6;56(5):807-22.
doi: 10.1016/j.neuron.2007.10.019.

Gating of Sema3E/PlexinD1 signaling by neuropilin-1 switches axonal repulsion to attraction during brain development

Affiliations

Gating of Sema3E/PlexinD1 signaling by neuropilin-1 switches axonal repulsion to attraction during brain development

Sophie Chauvet et al. Neuron. .

Abstract

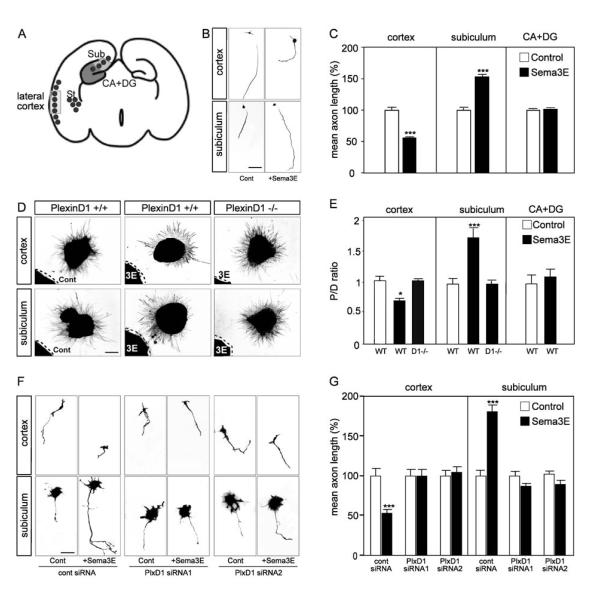
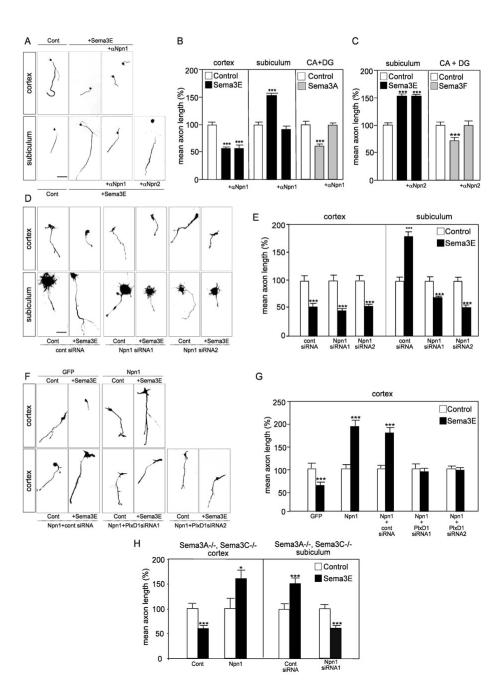
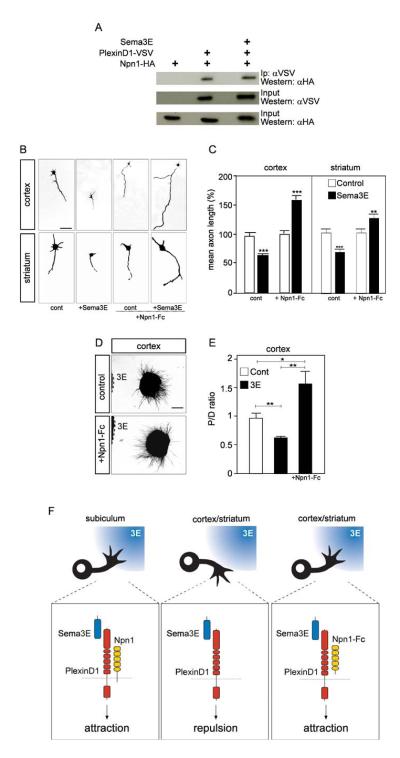
The establishment of functional neural circuits requires the guidance of axons in response to the actions of secreted and cell-surface molecules such as the semaphorins. Semaphorin 3E and its receptor PlexinD1 are expressed in the brain, but their functions are unknown. Here, we show that Sema3E/PlexinD1 signaling plays an important role in initial development of descending axon tracts in the forebrain. Early errors in axonal projections are reflected in behavioral deficits in Sema3E null mutant mice. Two distinct signaling mechanisms can be distinguished downstream of Sema3E. On corticofugal and striatonigral neurons expressing PlexinD1 but not Neuropilin-1, Sema3E acts as a repellent. In contrast, on subiculo-mammillary neurons coexpressing PlexinD1 and Neuropilin-1, Sema3E acts as an attractant. The extracellular domain of Neuropilin-1 is sufficient to convert repulsive signaling by PlexinD1 to attraction. Our data therefore reveal a "gating" function of neuropilins in semaphorin-plexin signaling during the assembly of forebrain neuronal circuits.


Figures

Fig. 1
Fig. 1. Binding sites for Sema3E along the corticofugal and striatonigral tracts
(A) Schematic representation of the path taken by corticofugal and striatonigral axons from the ventrolateral cortex (Ctx) and striatum (St), respectively, through the internal capsule (ic) and the cerebral peduncles (cp). At the midbrain level, striatal axons leave the cerebral peduncles and terminate in the substantia nigra (SN), whereas cortical axons continue into the pons. (B-G) Localization of Sema3E binding sites along the corticofugal and striatonigral projections on coronal sections of wild-type brain at E17.5. (B-D) Binding of Sema3E-AP is apparent in the internal capsule (ic in B) and cerebral peduncles (cp in C, D). (E-G) Higher magnifications of the areas in boxes 1-3 in B-D. (H-J) Immunolabeling of the candidate receptor components PlexinD1 (red) and Npn-1 (green) on coronal sections of wild-type brain at E17.5. High-magnification views at different levels of the corticofugal and striatonigral pathways (ic in H, cp in I, J) show that PlexinD1 is expressed throughout the corticofugal and striatonigral projections but that no co-expression of Npn-1 can be detected on these axons. At brainstem level, Npn-1 is expressed in an unidentified fiber tract adjacent to the corticofugal axons (I).Apparent interruption of the cerebral peduncles corresponds to a level at which corticofugal axons are out of the plane of section. (K-M) Coronal sections of E17.5 wild-type mouse brain were taken through the globus pallidus and thalamic reticular nucleus (K) and through the left hemisphere (L, M). They were hybridized with probes for: Sema3E (K), PlexinD1 (L) and Npn-1 (M). Strong signal for Sema3E can be seen in the globus pallidus (GP) and thalamic reticular nucleus (TRN) between which corticofugal and striatonigral axons must pass (box 1 in panel A). PlexinD1 mRNA is expressed ventrolateral regions of the cortex, whereas Npn-1 mRNA shows complementary expression in dorsomedial regions of the cortex. PlexinD1 mRNA, but not Npn-1 mRNA, is expressed in the striatum. Inset panel in L show high-magnification view of staining in the cortical plate of the ventrolateral cortex. ISH: in situ hybridization. Scale bars: 650 μm (A-D), 100 μm (E-K), 50 μm (L-M).
Fig. 2
Fig. 2. Binding sites for Sema3E along the subiculo-mammillary tract
(A) Schematic representation of the pathways taken by subiculo-mammillary projections, from the subiculum (Sub), through the fimbria (fim), fornix (F) and postcommissural fornix (PF). The target areas in the caudal hypothalamus are more caudal and are not shown on the scheme. (B-G) Localization of Sema3E binding partners along the subiculo-mammillary tract on coronal sections of wild-type brain at E17.5. (B-D) Binding of Sema3E-AP is apparent in the fimbria (fim in B), fornix (F in C) and postcommissural fornix (PF in D). (E-G) Higher magnifications of the areas boxed in B-D. (H-J) Immunolabeling of the candidate receptor components PlexinD1 (red) and Npn-1 (green) on coronal sections of wild-type brain at E17.5. High-magnification views of immunostaining at different levels of the subiculo-mammillary body tract (fim in H, F in I and PF in J) show that PlexinD1 is co-localized with Npn-1 along the full length of the subiculo-mammillary tract. Inset panel in J shows overlap in individual axonal fascicles. (K-M) Coronal sections of wild-type brain at E17.5 were taken through the hippocampal formation. Sections were hybridized with probes for: Sema3E (K), PlexinD1 (L) and Npn-1 (M). Note that the pyramidal layers in the subiculum co-express PlexinD1 together with Npn-1. Sema3E is expressed in CA1 and CA3 pyramidal neurons adjacent to the subiculum. Inset panels in K, L, M show high-magnification views of staining in pyramidal layer of the subiculum. ac: anterior commissure, CA1 and CA3: cornus ammonis 1 and 3, DG: dentate gyrus, fr: fasciculus retroflexus, hipc: hippocampal commissure, ISH: in situ hybridization, Sp: septum. Scale bars: 650 μm (A-D), 250 μm (K-M), 100 μm (E-J).
Fig. 3
Fig. 3. Opposite effects of Sema3E inactivation on descending pathways correlate with presence or absence of Npn-1
(A-D) Schemes representing models for Sema3E function in the development of descending forebrain projections. (A, B) Corticofugal and striatonigral projections (red) express PlexinD1 but not Npn-1. Sema3E (blue) is expressed at high levels in the reticular nucleus of the thalamus (TRN), which lies on the dorsal side of the internal capsule (ic) and in the globus pallidus (GP), ventral to the internal capsule. In Sema3E null embryos (gray), some axons depart from their normal trajectory and grow through the reticular nucleus to terminate ectopically in the dorsal midbrain. This suggests that in this system, Sema3E serves as a repulsive signal for growing axons. (C, D) Subiculo-mammillary axons (orange) express both PlexinD1 and Npn-1. Sema3E is expressed by pyramidal neurons of the hippocampal CA1 field (blue) and therefore is likely to be present along the full length of CA1 efferent projections adjacent to subiculo-mammillary axons in the fimbria and fornix. In the absence of Sema3E (gray), the development of subicular projections is massively delayed and only few fibers reach their target in the hypothalamus. This suggests that in this system, Sema3E serves as an attractive and/or growth-promoting signal for growing subicular axons. (E, F) Sema3E-AP binding to the internal capsule of E17.5 wild-type (E) and Sema3E null (F) embryos. In mutant embryos, a fraction of labeled fibers defasciculates from the internal capsule and grows through the reticular nucleus of the thalamus (arrows). (G, H) Misguided axons terminate ectopically in the dorsal midbrain of Sema3E-/- mutant embryos (arrows). High-magnification views of Sema3E-AP binding in the dorsal midbrain of wild-type (G) and Sema3E-/- (H) embryos. (I-L) Coronal sections of E17.5 mouse brain showing Sema3E-AP binding to the post-commissural fornix (PF) in wild-type (I, K) but not Sema3E-/- (J, L) embryos. K and L are magnified views of regions of the hypothalamus corresponding to boxed areas in I and J, respectively. (M, N) Coronal sections through the caudal hypothalamus of E17.5 control (M) and Sema3E-/- mutant (N) brains after anterograde DiI tracing of the fornix from the hippocampal formation. Very few labeled axons can be observed in the postcommissural fornix of Sema3E null embryos (arrow). (O, P) PlexinD1 null mutants phenocopy Sema3E-/- embryos. Subiculo-mammillary body projections in E17.5 wild-type (O) and PlexinD1-/- (P) brains were traced by DiI injection in the hippocampal formation. Only a small number of labeled axons was observed in the caudal hypothalamus of PlexinD1 null embryos (arrow). ac: anterior commissure, cp: cerebral peduncles, Ctx: Cortex; CA1 and CA3: cornus ammonis 1 and 3, f: fornix, fim: fimbriae, fr: fasciculus retroflexus, GP: globus pallidus, hipc: hippocampal commissure, ic: internal capsule, pf: postcommissural fornix, R->C, rostrocaudal axis, SN: substantia nigra, Sp: septum, St: striatum, Sub: subiculum, TRN, thalamic reticular nucleus. Scale bars: 650 μm (I, J), 120 μm (K-P), 100 μm (E-H).
Fig. 4
Fig. 4. Adult Sema3E null-mutant mice show behavior consistent with mammillary body denervation
(A, B) Fibers defasciculating from the internal capsule are no longer detected at postnatal stages. Sema3E-AP binding to the internal capsule of P4 wild-type (A) and Sema3E null (B) mice. (C, D), Reduced size of the postcommissural fornix in adult Sema3E-/- mice (D) as compared to wild-type animals (C). Anti-neurofilament staining of coronal sections of mouse brain at postnatal day 30. (E-H) Anxiety levels in Sema3E-/- mice assessed using the elevated plus maze. Results were quantified using an index which takes into account the number of entries (E, F) or duration (G, H) in each category of arm (E, G) and extremities of arms (F, H) as the ratio open arms/(open + closed arms). Data are presented as mean ± s.e.m. As compared to wild-type mice (open bars), Sema3E-/- mice (black bars) made more frequent visits to open arms than to closed arms (E), and to their extremities (F). They also spent significantly more time in open arms than in closed arms (G) and their extremities (H). (I) Spatial reference memory in Sema3E-/- mice assessed in the hidden platform version of the Morris water maze. Escape latencies (mean ± s.e.m., averaged value from 4 trials) on successive days are shown. Days 1-9: acquisition stage with the hidden platform located in a fixed position; Days 12-14: re-learning after a 13-day rest period; Days 15-18: reversal after relocation of the platform. Wild-type and Sema3E-/- mice learned the three stages of the task equally well. (J) Spatial working memory in Sema3E-/- mice assessed using a version of the Morris water maze in which the platform is changed from day to day. Escape latencies per trial (mean ± s.e.m.; averaged value over 5 days) over successive trials on each day are shown. Sema3E-/- mice showed weaker performance than wild-type mice on the first daily trial (p=0.03) but improved their performance during the four daily trials (p=0.01). Wild-type mice showed no improvement (p=0.26) over the same period. GP: globus pallidus; ic: internal capsule, pf : postcommissural fornix, TRN : thalamic reticular nucleus. *significantly different with p<0.05, **significantly different with p<0.01, ***significantly different with p<0.005. Scale bars: 100 μm (A, B), 120 μm (C, D).
Fig. 5
Fig. 5. PlexinD1 is required for both positive and negative effects of Sema3E
(A) Schematic diagram of a coronal section through E17.5 brain illustrating the cortical and hippocampal regions dissected for in vitro assays. Black dots indicate regions of PlexinD1 expression. (B) Typical images of dissociated neurons cultured in the presence or absence of 5 nM Sema3E. Adding Sema3E inhibits the extension of cortical axons but stimulates the growth of subicular axons. (C) Histograms Sema3E effects in cultures of subicular, cortical and control hippocampal (CA+DG) dissociated cells. Data are presented as mean axonal length ± s.e.m. (n=3) and are normalized to 100% for values obtained in control conditions. Sema3E significantly inhibits cortical growth and stimulates growth of subicular axons, but has no effect on hippocampal axons. (D) Typical patterns of axonal outgrowth from explants co-cultured with Sema3E-expressing HEK293T cells, and stained with SMI-31 neurofilament antibody. Cortical explants show chemorepulsion whereas subicular explants show chemoattraction. Neither attraction nor repulsion was seen in explants from PlexinD1-/- embryos. (E) Quantification of the axonal guidance response of cortical, subicular and hippocampal neurons to control and Sema3E-expressing HEK293T cells. Data are expressed as P/D ratio, where P and D are the mean lengths of axons in the quadrant proximal and distal to the cell aggregate (Cheng et al., 2001). A P/D ratio close to 1 indicates radial outgrowth. Cortical axons are repelled by a source of diffusible Sema3E, whereas subicular axons are significantly attracted and hippocampal axons show no response. All growth responses to Sema3E are PlexinD1-dependent (columns labeled D1-/- performed using PlexinD1-/- explants). (F) Dissociated cortical and subicular neurons electroporated with GFP-expressing vector together with either control siRNA or PlexinD1 siRNAs 1 and 2 (see Experimental Procedures) were cultured in the presence or absence of 5 nM Sema3E. (G) Quantification of the effects of siRNAs on axon length. Knock-down of PlexinD1 abolishes both the growth-inhibitory and the growth-promoting effects of Sema3E. Mean axonal lengths are calculated as a percentage of mean values obtained in control conditions for each experiment. CA: cornus ammonis, DG: dentate gyrus, Sub: subiculum. *significantly different with p<0.05; ***significantly different with p<0.001. Scale bars: 30 μm (B, F), 150 μm (D).
Fig. 6
Fig. 6. Levels of Npn-1 gate the responses of cortical and subicular axons to Sema3E
(A) Typical images of dissociated neurons cultured in the presence or absence of 10 μg/ml polyclonal anti-Npn-1 or anti-Npn-2, and of Sema3E. Blockade of Npn-1 prevents stimulation of subicular axon growth by Sema3E, but not inhibition of cortical axon growth by Sema3E. Anti-Npn-2 antibodies do not affect the growth-promoting effect of Sema3E on subicular axons. (B, C) Quantification of the results illustrated in A. Data are presented as mean axonal length ± s.e.m. (n=3) and are normalized to 100% for values obtained in control conditions. The anti-Npn-1 and anti-Npn-2 antibodies prevent inhibition of hippocampal axon growth by Sema3A (B) and Sema3F (C), respectively, confirming their neutralization efficiency. (D) Typical images of dissociated neurons cultured in the presence or absence of 5 nM Sema3E after electroporation of the indicated siRNAs. Knock-down of Npn-1 causes subicular neurons to switch their response to Sema3E from promotion to inhibition but does not affect inhibition of cortical axon growth by Sema3E. (E) Quantification of the results illustrated in D. Data are presented as mean axonal length ± s.e.m. (n= 3) and are normalized to 100% for values obtained in control conditions. (F) Typical images of dissociated neurons cultured in the presence or absence of 5 nM Sema3E after electroporation of expression vectors encoding GFP or Npn-1 together with the indicated siRNAs. Misexpression of Npn-1 confers on cortical neurons the ability to respond positively to Sema3E in a PlexinD1-dependent manner. (G) Quantification of the results illustrated in F. Data are presented as mean axonal length ± s.e.m. (n= 3) and are normalized to 100% for values obtained in control conditions. (H) To exclude the possibility that Npn-1 was acting as a receptor for other semaphorins produced in an autocrine manner (Bachelder et al., 2003; Serini et al., 2003; De Wit et al; 2005), responses of neurons from double mutant Sema3A-/-; Sema3C-/- embryos to Sema3E were quantified. Data are presented as mean axonal length ± s.e.m. (n= 3) and are normalized to 100% for values obtained in control conditions. Even in these mutant cells, misexpression of Npn-1 in cortical neurons and knock-down of Npn-1 in subicular neurons induce switches in axonal responses to Sema3E that are similar to those observed using wild-type neurons. CA: cornus ammonis, DG: dentate gyrus. *significantly different with p<0.05; *** significantly different with p<0.001. Scale bar: 30 μm (A, D, F).
Fig. 7
Fig. 7. The extracellular domains of Npn-1 and PlexinD1 interact to signal growth
(A) Co-immunoprecipitation experiments showing that PlexinD1 can form a complex with Npn-1 in both the presence and absence of Sema3E. COS-7 cells were transfected with the indicated combinations of HA-tagged Npn-1 and VSV-tagged PlexinD1, and treated or not with Sema3E (5 nM). (B) Typical images of dissociated cortical and striatal neurons cultured in the presence or absence of 5 nM Sema3E and 2 μg/ml Npn1-Fc. Like cortical neurons, striatal neurons show a growth inhibitory response to Sema3E. Soluble Npn1-Fc switches the growth response of cortical and striatal neurons to Sema3E from inhibition to stimulation. (C) Quantification of the results illustrated in B. Data are presented as mean axonal length ± s.e.m. (n= 3) and are normalized to 100% for values obtained in control conditions. (D) Typical patterns of axonal growth from cortical explants, stained with SMI-31 antibody, in co-cultures with Sema3E-expressing HEK293T cells. Cortical axons, normally repelled by secreted Sema3E, show chemoattraction toward Sema3E in the presence of 2 μg/ml Npn1-Fc. (E) Quantification of the guidance response of cortical neurons to control and Sema3E-expressing HEK293T cells in presence of 2 μg/ml Npn1-Fc. Data are expressed as P/D ratio, where P and D are the length of axons in the quadrants proximal and distal to the cell aggregate (Cheng et al., 2001). A P/D ratio close to 1 indicates radially symmetric outgrowth. (F) Molecular model for bifunctional signaling by Sema3E. Axons of subicular neurons express both PlexinD1 and Npn-1 and show a chemoattractive (or growth-promoting) response to Sema3E (left panel). In contrast, Sema3E chemorepels (or inhibits growth from) axons of cortical and striatal neurons, which express PlexinD1 but not Npn-1 (middle panel). The extracellular domain of Npn-1 is sufficient to “gate” PlexinD1 signaling and cause cortical and striatal neurons to grow towards a source of Sema3E (right panel). *significantly different with p<0.05; **significantly different with p<0.01; ***significantly different with p<0.001. Scale bar: 30 μm (B), 150 μm (D).

Similar articles

Cited by

References

    1. Artigiani S, Conrotto P, Fazzari P, Gilestro GF, Barberis D, Giordano S, Comoglio PM, Tamagnone L. Plexin-B3 is a functional receptor for semaphorin 5A. EMBO Rep. 2004;5:710–714. - PMC - PubMed
    1. Bachelder RE, Lipscomb EA, Lin X, Wendt MA, Chadborn NH, Eickholt BJ, Mercurio AM. Competing autocrine pathways involving alternative neuropilin-1 ligands regulate chemotaxis of carcinoma cells. Cancer Res. 2003;63:5230–5233. - PubMed
    1. Bagnard D, Lohrum M, Uziel D, Puschel AW, Bolz J. Semaphorins act as attractive and repulsive guidance signals during the development of cortical projections. Development. 1998;125:5043–5053. - PubMed
    1. Bagri A, Tessier-Lavigne M. Neuropilins as Semaphorin receptors: in vivo functions in neuronal cell migration and axon guidance. Adv Exp Med Biol. 2002;515:13–31. - PubMed
    1. Bagri A, Marin O, Plump AS, Mak J, Pleasure SJ, Rubenstein JL, Tessier-Lavigne M. Slit proteins prevent midline crossing and determine the dorsoventral position of major axonal pathways in the mammalian forebrain. Neuron. 2002;33:233–248. - PubMed

Publication types

MeSH terms

LinkOut - more resources