

Comparison of central corneal thickness using anterior segment optical coherence tomography vs ultrasound pachymetry
- PMID: 18054888
- PMCID: PMC4431580
- DOI: 10.1016/j.ajo.2007.09.030
Comparison of central corneal thickness using anterior segment optical coherence tomography vs ultrasound pachymetry
Abstract
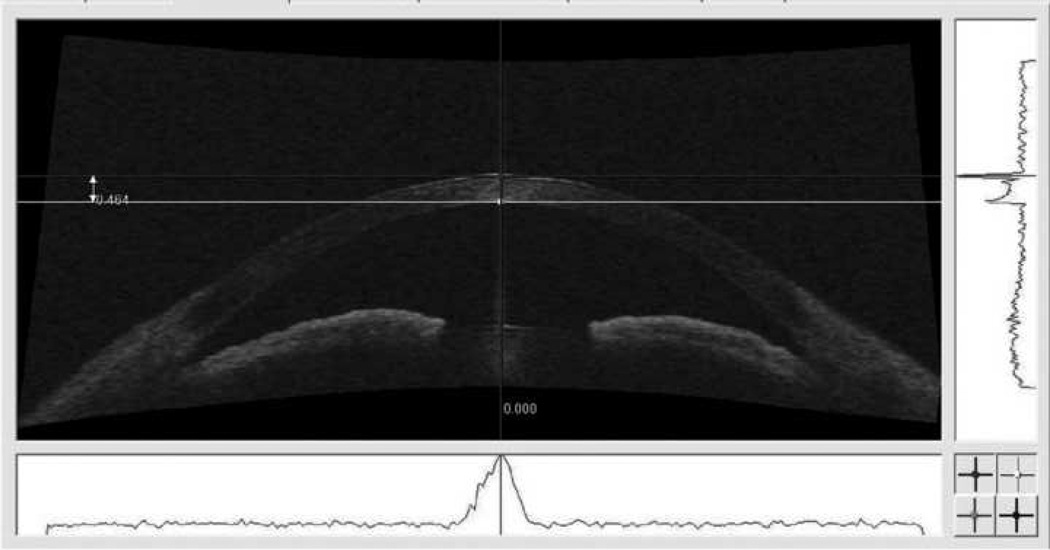
Purpose: To determine if there is a systematic difference in central corneal thickness (CCT) measured using anterior segment optical coherence tomography (AS-OCT) as compared with ultrasound pachymetry.
Design: Prospective observational study.
Methods: Consecutive subjects with clinically normal corneas underwent CCT measurement by both ultrasound and AS-OCT while participating in a population-based study in Ghana, West Africa. One eye of each subject was randomly selected for analysis. Two measurements were taken and averaged. Agreement and interobserver variability were also analyzed.
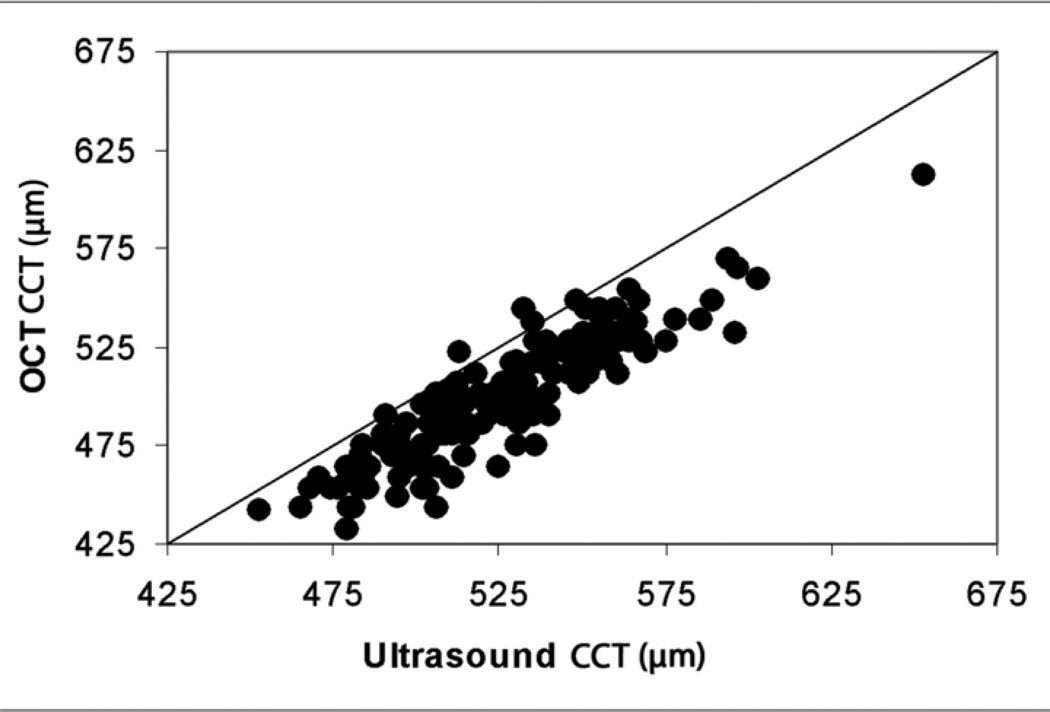
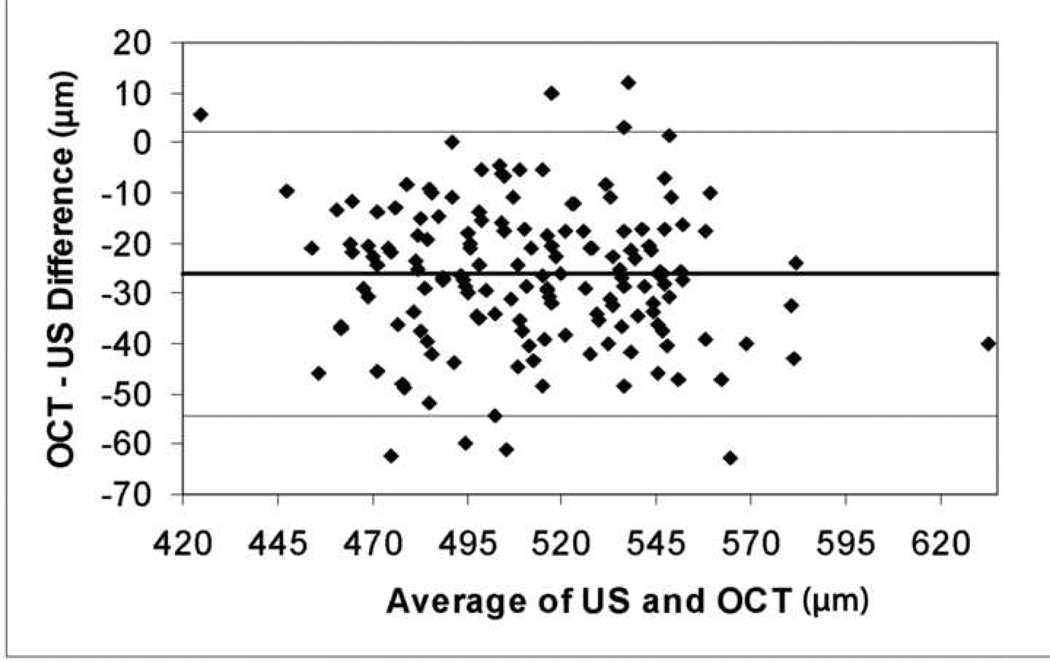
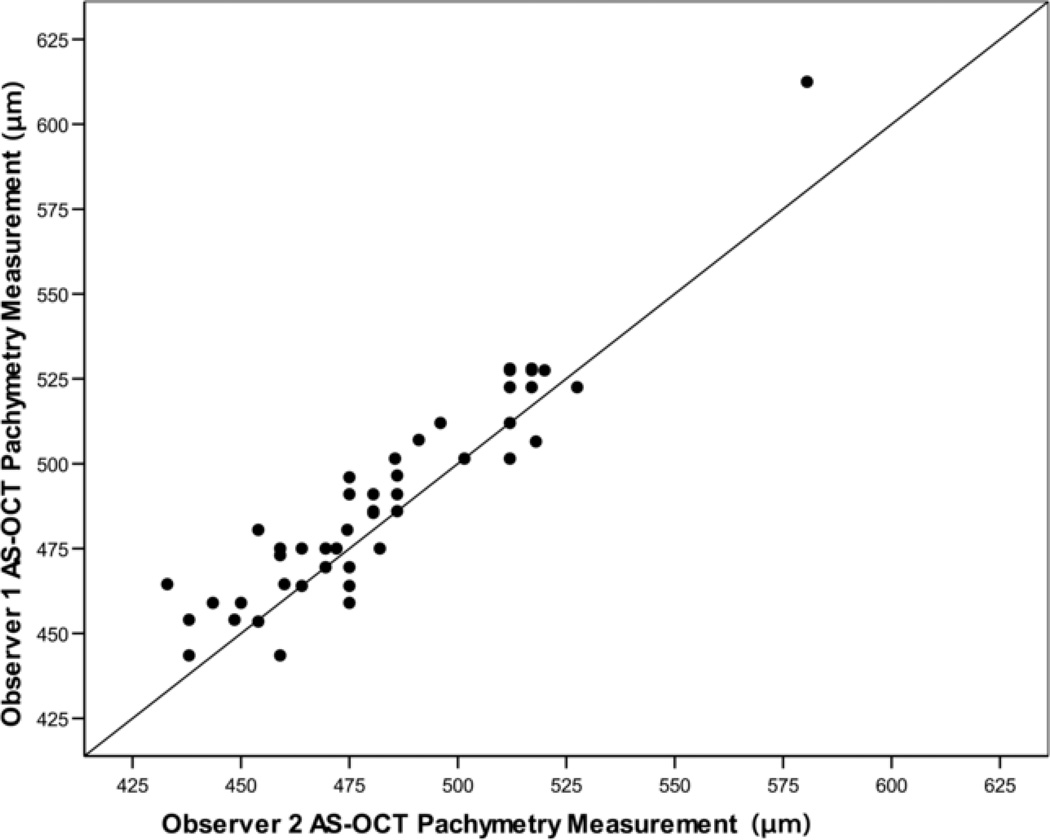
Results: One hundred and fifty-five subjects of African ethnicity and average age 57 years (standard deviation [SD] 12; range, 40 to 98 years) were included. Measurements by AS-OCT and US were taken a mean of 15 days (maximum, six weeks) apart. The mean (SD) [range] US CCT was 525.3 microm (33.5) [422, 653] and 499.0 microm (32.0) [428, 613] with AS-OCT. Measurements by the two modalities were strongly correlated (r(2) = 0.82; P < .001), and a significant difference was observed between mean US and AS-OCT CCT (SD) [range] of 26.3 microm (14.2) [-63, 12] (P < .001). The width of the limits of agreement was 28 microm, about 6% of the average pachymetry reading. In 50 eyes randomly remeasured with OCT by a second observer, the intraclass correlation coefficient was 0.91. There was a small but significant systematic difference between observers (mean 6.9 microm, SD 10.9 microm), or 1.4% (P < .001), increasing the difference noted above.
Conclusion: There is a reproducible systematic difference between CCT measurements taken with ultrasound and OCT. It is important to note in clinical practice, that measurements acquired by these two modalities are not directly interchangeable.
Figures
References
-
- Wolffsohn JS, Davies LN. Advances in anterior segment imaging. Curr Opin Ophthalmol. 2007;18:32–38. - PubMed
-
- Doughty MJ, Zaman ML. Human corneal thickness and its impact on intraocular pressure measures: a review and meta-analysis approach. Surv Ophthalmol. 2000;44:367–408. - PubMed
-
- Wirbelauer C, Scholz C, Hoerauf H, et al. Noncontact corneal pachymetry with slit lamp-adapted optical coherence tomography. Am J Ophthalmol. 2002;133:444–450. - PubMed
-
- Wong AC, Wong CC, Yuen NS, Hui SP. Correlational study of central corneal thickness measurements on Hong Kong Chinese using optical coherence tomography, Orbscan and ultrasound pachymetry. Eye. 2002;16:715–721. - PubMed
Publication types
MeSH terms
Grants and funding
LinkOut - more resources
Full Text Sources
Research Materials
