. 2007 Dec;27(6):847-59.
doi: 10.1016/j.immuni.2007.10.009. Epub 2007 Dec 6.

microRNA-155 regulates the generation of immunoglobulin class-switched plasma cells

Affiliations

microRNA-155 regulates the generation of immunoglobulin class-switched plasma cells

Elena Vigorito et al. Immunity. 2007 Dec.

Abstract

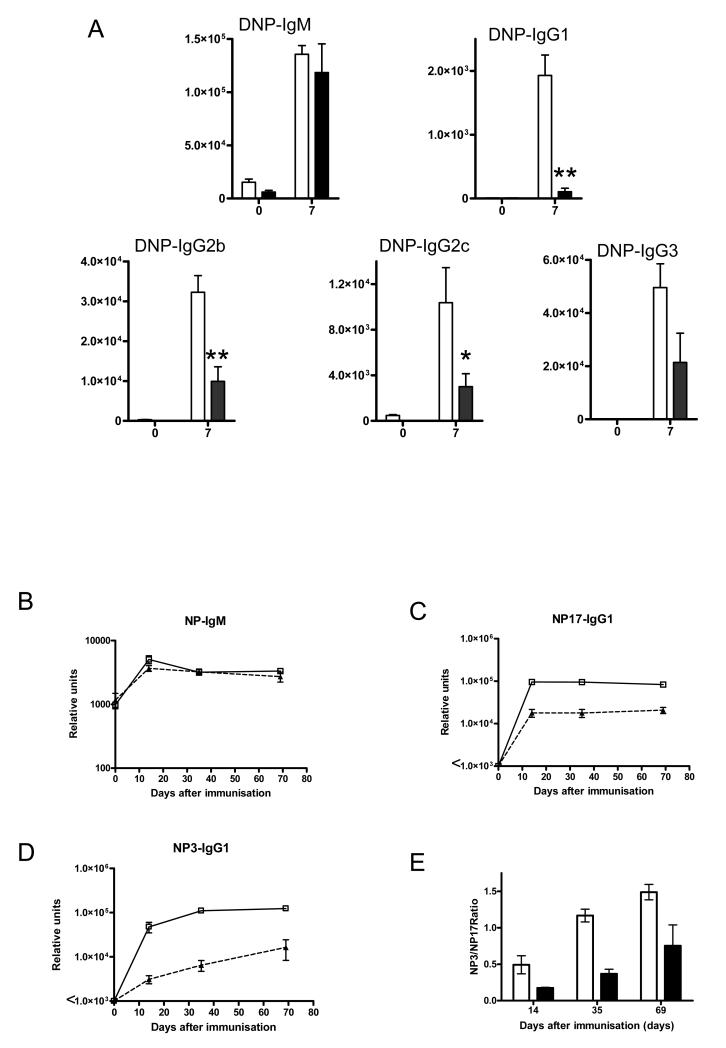
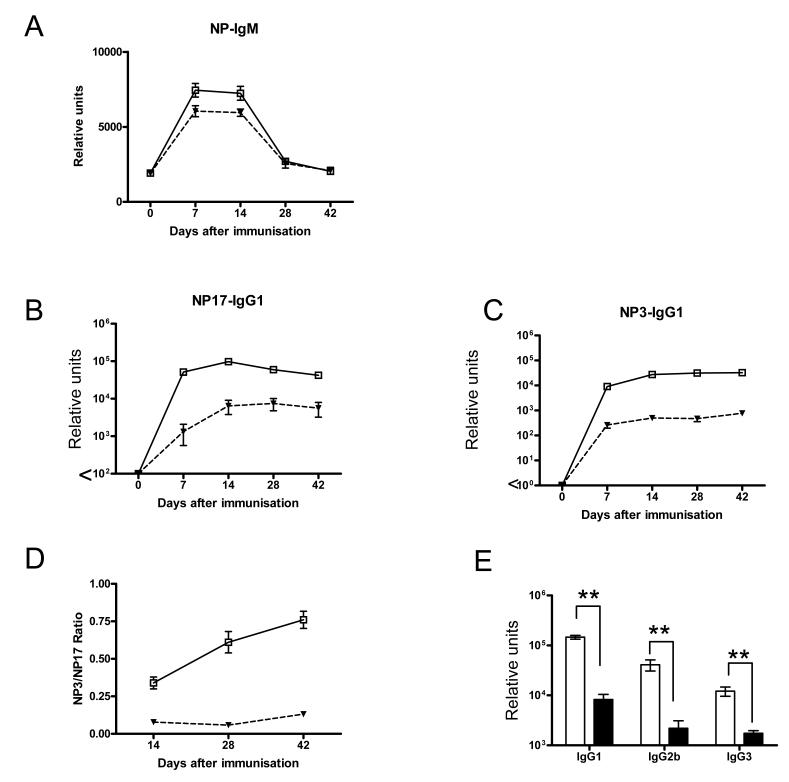
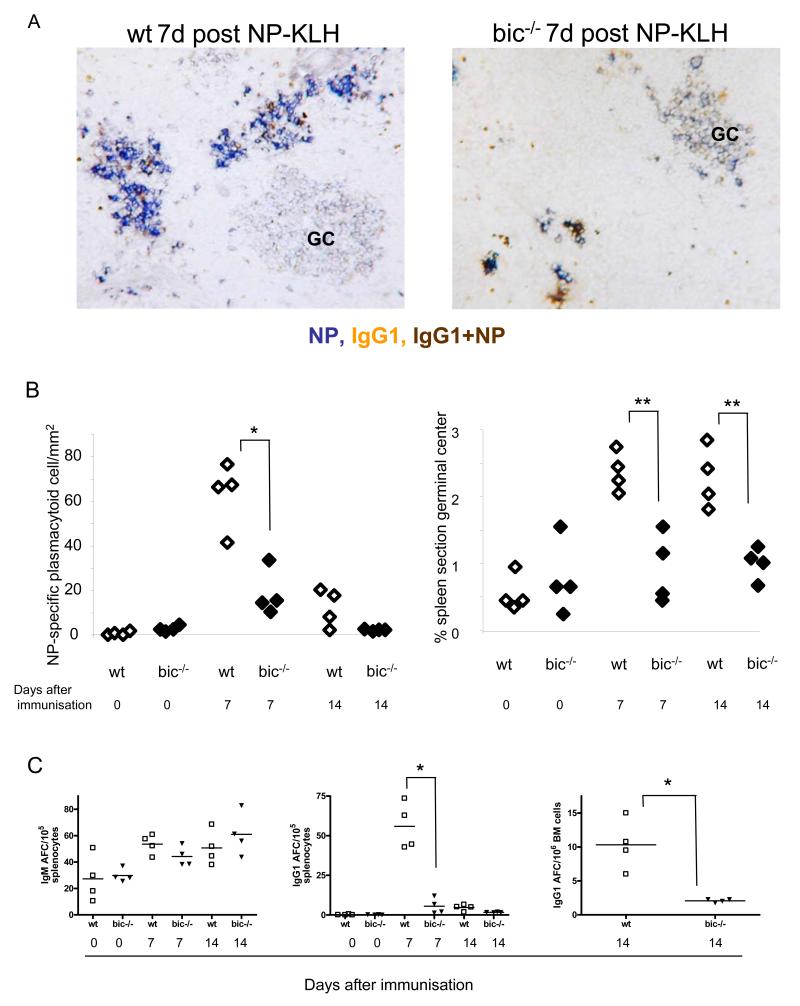
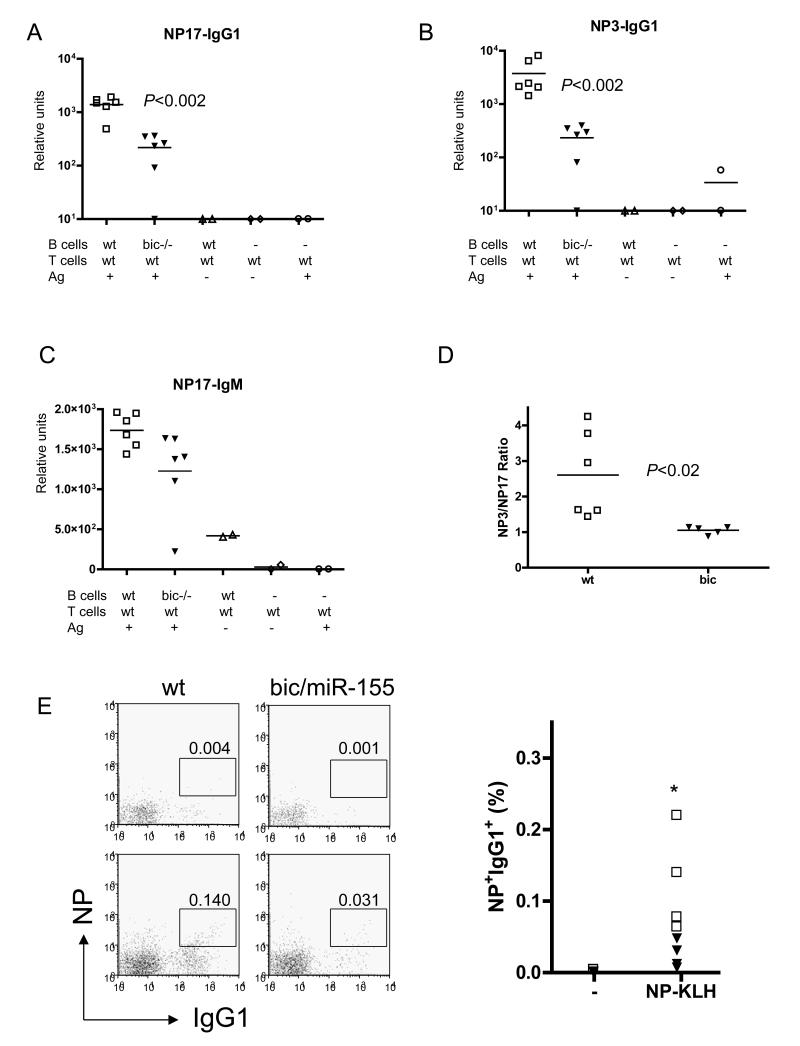
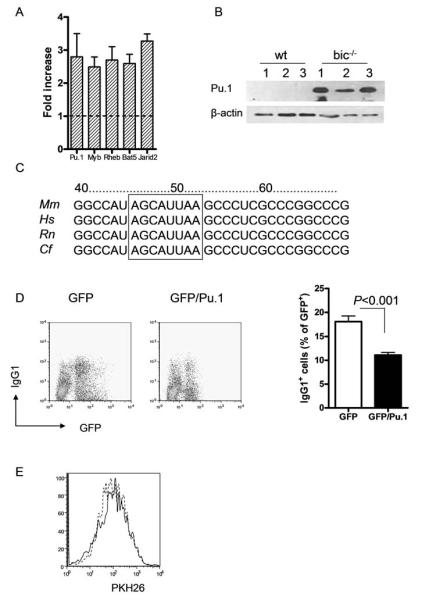
microRNA-155 (miR-155) is expressed by cells of the immune system after activation and has been shown to be required for antibody production after vaccination with attenuated Salmonella. Here we show the intrinsic requirement for miR-155 in B cell responses to thymus-dependent and -independent antigens. B cells lacking miR-155 generated reduced extrafollicular and germinal center responses and failed to produce high-affinity IgG1 antibodies. Gene-expression profiling of activated B cells indicated that miR-155 regulates an array of genes with diverse function, many of which are predicted targets of miR-155. The transcription factor Pu.1 is validated as a direct target of miR155-mediated inhibition. When Pu.1 is overexpressed in wild-type B cells, fewer IgG1 cells are produced, indicating that loss of Pu.1 regulation is a contributing factor to the miR-155-deficient phenotype. Our results implicate post-transcriptional regulation of gene expression for establishing the terminal differentiation program of B cells.


Figures

Figure 1
Figure 1. miR-155 deficient mice produce reduced amounts of low affinity IgG1 antibodies
(A) Wild type (open squares) or miR-155 deficient chimeric mice (filled triangles) were immunized with DNP-LPS and anti-DNP specific antibody titers were measured 7 days later. “*” corresponds to P<0.05 and “**” to P<0.005 using Student t-test. (B-C) Wild type (open squares) or miR-155 deficient mice (filled triangles) were immunized with NP-KLH in alum at day 0 and day 70, indicated by the arrowheads. Production of NP specific antibody titers were measured at the indicated times. (B) Titers of IgM anti-NP were measured using NP17-BSA (left). Titers of IgG1 anti-NP measured using NP17-BSA (middle) or NP3-BSA (right). (C) Ratio of the IgG1 titers detected using NP3-BSA to those with NP17-BSA. Each symbol corresponds to one mouse. Statistical analysis: two-way ANOVA was performed for panels (B)-(C) and P<0.0001 for the genotype and time effect for NP-specific IgG1 antibodies of low and high affinity. Similar experiments were done twice.
Figure 2
Figure 2. The deficiency in switched antibody production in miR-155 deficient mice is B cell intrinsic
Wild type (open squares) or miR-155 deficient (filled triangles) chimeras were immunized with NP-KLH in alum at day 0. Titers of IgM anti-NP (A) or IgG1 (B) were measured using NP17-BSA. (C) Titers of IgG1 anti-NP measured using NP3-BSA. (D) Ratio of the IgG1 titers detected using NP3-BSA to those with NP17-BSA. (E) Titers of IgG1, IgG2b and IgG3 anti-NP at day 14 after immunization. Each symbol corresponds to one mouse. Statistical analysis: P<0.0001 for the genotype and time effect of a two-way ANOVA analysis for panels (B)-(D). For panel (E) the Student-t test was used: “**” indicates P<0.001. Similar experiments were done twice.
Figure 3
Figure 3. Impaired extrafollicular and germinal centre response in the absence of miR-155
(A) Immunohistochemical analysis of splenic sections from wild type (WT) or miR-155 chimeric mice showing NP-binding cells (blue) and IgG1 positive cells (orange) on day 7 after immunization with NP-KLH. (B) Wild type (open squares) or miR-155 deficient (filled triangles) chimeras were immunized with NP-KLH. The graph on the left shows the number of NP-specific extrafollicular plasmacytoid cells per mm2 of spleen section. The graph on the right shows the percentage of splenic section occupied by germinal centers. (C) ELISPOT analysis of splenic NP-specific IgG1 AFC (left panel) or bone marrow NP- specific IgG1 AFC (right panel). (B-C). Each symbol represents one mouse and the horizontal bar corresponds to the media. Statistical analysis was performed using one-way ANOVA. “*” indicates P<0.05, “**” P<0.001. In panel (B) no significance difference (P>0.05) was observed when comparing miR-155 deficient NP-specific extrafollicular plasmacytoid cells per mm2 at day 0 with day 7 or day 14. Similar experiments were repeated 2-3 times.
Figure 4
Figure 4. The defective memory response in miR-155 deficient mice is B cell intrinsic
NP-primed B cells from wild type (WT) or miR-155 deficient (Mir-155) chimeras were mixed with wild type carrier-primed T cells and transferred into Rag2−/− Il2rg−/− deficient mice. Subsequently, recipient mice were immunized with soluble NPKLH and one week later antigen-specific IgM and IgG1 measured. Control groups are indicated. Titers of IgG1 anti-NP measured using NP17-BSA (A) or NP3-BSA (B). (C) Titers of IgM anti-NP using NP17-BSA. (D) Ratio of the IgG1 titers detected using NP3-BSA to those with NP17-BSA. Each symbol represents an individual mouse and horizontal bars indicate the average. The indicated “P values” were calculated using Student’s t-test. (E) Frequency of memory B cells after 42 days of immunization with NP-KLH. Red blood cell depleted splenic cells were gated as B220+, CD4, CD8, IgM, IgD, Gr-1, F4/80, PI, and analyzed for the expression of NP and IgG1. Dot plots correspond to a representative example of a mouse of each genotype. The top panel corresponds to non-immunized mice, the bottom panel to NP-KLH immunized mice. The boxes indicate the frequency of NP+, IgG1+ cells. The graph summarizes the results of 4 mice each genotype, open squares correspond to wild type, filled triangles to miR-155 deficient mice. A significance reduction in the proportion of NP+IgG1+ cells after immunization was observed in the absence of miR-155 (P=0.03, by Student-t test).
Figure 5
Figure 5. Hypermutation in miR-155 deficient B cells in Peyer’s patch GC despite impaired IgG1 secretion
(A) Analysis of mutations in the intronic VHJ558-JH rearrangement-flanking region of wild type and miR-155 deficient germinal centre B cells purified from Peyer’s Patches. Segment sizes in the pie charts are proportional to the number of sequences carrying the number of mutations indicated in the periphery of the charts. The total number of sequences analyzed is indicated in the centre of the chart. The frequency of mutations is expressed as the mean ± SD for 3 mice per group and the P value was calculated using Student t-test. The tables indicate the percentage nucleotide substitution. The total number of mutations was 275 for the wild type and 196 for the miR-155 deficient mice. (B-C) Splenic B cells were cultured with LPS+IL-4 for 3 days. Each symbol corresponds to B cells isolated from an individual mouse and the horizontal bar indicates the average, open squares correspond to wild type B cells, filled triangles to miR-155 deficient. (B) Induction of Aicda (C) Expression of μ encoding sterile transcripts (left panel), γ1 encoding sterile transcripts (middle panel) and post-switch encoding γ1 circular transcripts (right panel). This experiment was repeated 2-3 times.
Figure 6
Figure 6. Enrichment for miR-155 “seeds” in genes upregulated in miR155 deficient B cells
(A) Representation of miR-155 “seeds” in the group of upregulated genes in miR-155 deficient B cells. Genes were grouped according to their content of 6-nt seeds, 7 nt(1), 7 nt(2) or 8 nt- miR-155 seeds and represented in a pie chart. (B) Fold enrichment for 6-nt seeds, 7 nt(1), 7 nt(2) or 8 nt-miR-155 “seeds”. (C) Fold enrichment of mouse 5′miRNA “seed” sequences contained in the 3′UTRs of significantly upregulated genes. The P-value for miR-155 is indicated.
Figure 7
Figure 7. Pu.1 is a direct target of miR155 and its over-expression in wild type B cells results in a reduction of IgG1 switched cells
(A) Expression of Sfpi1, Myb, Rheb, Bat5 and Jarid2 was assessed by q-PCR. Data is represented as the fold increase in miR-155 relative to wild type amounts set at 1 (n=4). For all genes P≤0.05. (B) Protein expression of Pu.1 from B cell cultures from 3 wild-type and 3 miR-155 deficient mice. (C) Left panel, sequence alignment of part of the 3′UTR of PU.1 from different species. The 8nt-miR155 binding site is boxed. The AAU sequence indicated below the alignment shows the mutagen derivative created to assess miR155 dependent translational repression in the luciferase reporter assay. Wild type (WT) or mutant Pu.1 (mutant) plasmid were cotransfected with miR-155 mimic (closed bars) or control miR-124a (open bars). The right panel shows a significant miR-155 specific repression of Pu.1 reporter. *P<0.0001 in comparison with wild type plasmid treated control mimic by Student’s t test. (D-F) Wild type or miR-155 deficient B cells were cultured in the presence of LPS and IL-4. After 16 hours cells were transduced with retrovirus expressing GFP or GFP and Pu.1 and cultured for 3 more days. (D) Cultures were then stained for surface IgG1 expression. The left panel shows a representative example of cultures from one mouse transduced with each virus. The graph summarizes the results observed for cultures arising from four mice. (E) Same as (D) expect cells were stained for intracellular IgG1 (icIgG1) expression (left) or surface IgM (sIgM, right). (F) Before culture, B cells were stained with PKH26 to follow proliferation. Representative histograms gated on GFP+ cells for B cells transduced with GFP virus (black line) or GFP-Pu.1 (dashed line) are shown. This experiment was repeated 2-4 times.

Comment in

Similar articles

Cited by

References

    1. Bartel DP. MicroRNAs: genomics, biogenesis, mechanism, and function. Cell. 2004;116:281–297. - PubMed
    1. Blink EJ, Light A, Kallies A, Nutt SL, Hodgkin PD, Tarlinton DM. Early appearance of germinal center-derived memory B cells and plasma cells in blood after primary immunization. J Exp Med. 2005;201:545–554. - PMC - PubMed
    1. Brennecke J, Stark A, Russell RB, Cohen SM. Principles of microRNA-target recognition. PLoS Biol. 2005;3:e85. - PMC - PubMed
    1. Cattoretti G, Shaknovich R, Smith PM, Jack HM, Murty VV, Alobeid B. Stages of germinal center transit are defined by B cell transcription factor coexpression and relative abundance. J Immunol. 2006;177:6930–6939. - PubMed
    1. Cobb BS, Hertweck A, Smith J, O’Connor E, Graf D, Cook T, Smale ST, Sakaguchi S, Livesey FJ, Fisher AG, Merkenschlager M. A role for Dicer in immune regulation. J Exp Med. 2006;203:2519–2527. - PMC - PubMed

Publication types