. 2008 Feb 7;275(1632):335-44.
doi: 10.1098/rspb.2007.1394.

The effect of stimuli that isolate S-cones on early saccades and the gap effect

Affiliations

The effect of stimuli that isolate S-cones on early saccades and the gap effect

A J Anderson et al. Proc Biol Sci. .

Abstract

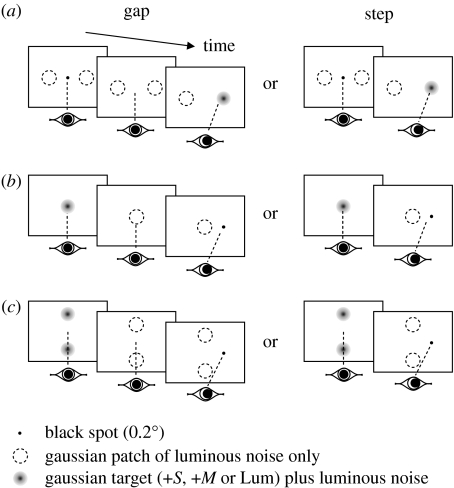
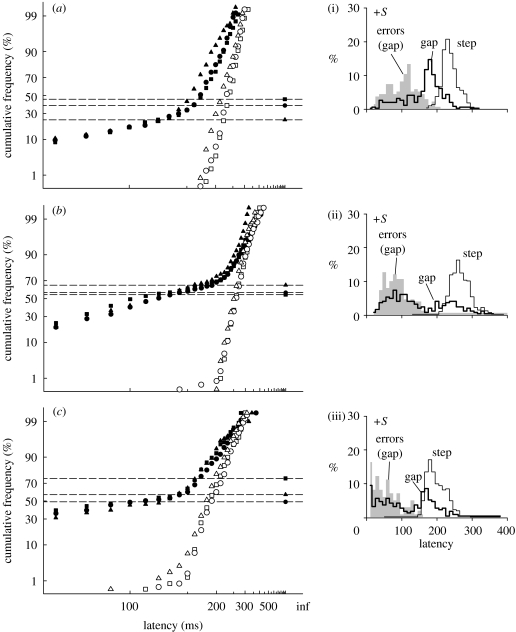
Disappearance of the fixation spot before the appearance of a peripheral target typically reduces average saccadic reaction times (the gap effect) and may also produce a separate population of early or express saccades. The superior colliculus (SC) is generally believed to be critically involved in generating both effects. As the direct sensory input to the SC does not encode colour information, to determine whether this input was critical in generating the gap effect or express saccades we used coloured targets which this pathway cannot distinguish. Our observers still made early saccades to colour-defined targets, but these were anticipations in response to the offset of the non-coloured fixation target. We also show that a gap effect still occurs when either the fixation target or the peripheral target is colour defined, suggesting that direct sensory input to the SC is not required and that information about the location of colour-defined targets is abstracted prior to processing within the SC.


Figures

Figure 1
Figure 1
Results of the tritan line location experiment, for (a) subjects A (circles) and B (squares), and (b) subjects C (triangles) and F (diamonds). Unfilled symbols give thresholds following the offset of a bright yellow adaptation background, and filled symbols give thresholds using a constant white background. Thresholds are in a scaled version of MacLeod–Boynton space (S/(L+M)×4.0), with angles giving the clockwise angular rotation of the theoretical tritan line. Solid curves give best fitting (least squares) three parameter templates described in the text.
Figure 2
Figure 2
Saccadic latency for coloured stimuli as a function of relative luminance, for a single observer (A). A scalar of 1.0 means that colours had the same luminance (CIE 1931 colour space) as the background. Targets were Gaussian patches (s.d.=0.3°) presented either centrally (upon which the subject looked towards 0.2° black dot continuously present at 4° peripherally) or 4° peripherally (circles, +S (peripheral); squares, +M (peripheral); and triangles, +M (central)). The lines give the best fitting (least squares) model described in the text (equation (2.2)).
Figure 3
Figure 3
Schematic of the protocols for the first three experiments ((a) experiment 1, (b) experiment 2, and (c) experiment 3). In each case, the final target is shown on the right although in 50% of trials it appeared on the left. Step and gap tasks were randomly interleaved on a trial-by-trial basis.
Figure 4
Figure 4
Experiment 1: (ac) reciprobit plots of saccadic latency for saccades in the correct direction, for a gap and step tasks for three observers. Targets were Gaussian patches located 4° either side of a black fixation spot. Isolated data points to the right of each panel give the number of saccades made in the opposite direction to the target (errors), expressed as a frequency (=errors/number of correct saccades): CIs for these frequencies are given in table 1. Median latencies (ms) were: (a) subject A (step: 230, 237, 214; gap: 182, 188, 166); (b) subject B (step: 259, 258, 250; gap: 150, 112, 128); and (c) subject C (step: 190, 186, 180; gap: 139, 103, 133; step task: open circles, open squares and open triangles; gap task: filled circles, filled squares and filled triangles (+S, +M, Lum), respectively). (i–iii) Latency distributions for the +S stimulus for both step (thin lines) and gap (thick lines) tasks and error distributions for the gap task (grey fill).
Figure 5
Figure 5
Experiment 2: reciprobit plots of saccadic latency, for a gap and step task. Fixation targets were Gaussian patches, and the peripheral target a black spot. Median latencies for the curves were: (a) subject A (step: 193, 195, 185 ms; gap: 159, 164, 162 ms); (b) subject B (step: 261, 257, 254 ms, gap: 240, 243, 237 ms); and (c) subject F (step: 213, 221, 229 ms, gap: 199, 201, 207 ms; step task: open circles, open squares and open triangles; gap task: filled circles, filled squares and filled triangles (+S, +M, Lum), respectively). All stimulus conditions gave a significant gap effect for all subjects (subject F, +S, p=0.006: all others p<0.001).
Figure 6
Figure 6
Mean reaction times for a step (unjoined data points) and gap (joined with lines) task as a function of fixation target luminance, for a luminous increment (circles) and a+M cone stimulus (squares), both presented without luminous noise: (a) subject A; (b) subject B; (c) subject C; and (d) subject D. A luminance scalar of 1.0 means that target had the same luminance (CIE 1931 colour space) as the background. The peripheral target was a black spot. Error bars give ±s.e.m. of the mean for the gap task only. Each datum point represents the mean of approximately 55 latencies.
Figure 7
Figure 7
Experiment 3: (ac) reciprobit plots of saccadic latency, for a gap and step task for three observers. The target was a black spot and ‘fixation’ targets were Gaussian patches placed 4° above and below the centre of the screen. Median latencies for the curves were: (a) subject A (step: 188, 186, 189 ms; gap: 175, 172, 160 ms); (b) subject B (step: 266, 266, 261 ms, gap: 246, 249, 236 ms); and (c) subject C (step: 147, 146, 151 ms, gap: 141, 140, 135 ms; step task: open circles, open squares and open triangles; gap task: filled circles, filled squares and filled triangles (+S, +M, Lum), respectively). A significant gap effect was present for all stimulus conditions for all three subjects (subjects A and B, p<0.001; subject C p=0.01, 0.02 and <0.001 for +S, +M and Lum, respectively).
Figure 8
Figure 8
Median latencies for overlap and gap tasks. ‘Fixation’ targets were Gaussian patches placed above and below the centre of the screen, and the target to saccade was a black spot. Each datum point represents the median of approximately 200 saccadic latencies, except for subject F who performed twice this number for the +M condition. For all observers, latencies were significantly faster for the central-gap condition than the peripheral-gap condition ((a) subject A: p=0.02,<0.001 and 0.04 [+S, +M and Lum]; (b) subject B: p=0.006,<0.001 &<0.001; and (c) subject F: p=0.001, 0.05 and <0.001; circles, +S; squares, +M; and triangles, Lum).

References

    1. Carpenter R.H.S. Oculomotor procrastination. In: Fisher D.F, Monty R.A, Senders J.W, editors. Eye movements: cognition and visual perception. Lawrence Erlbaum Associates; Hillsdale, NJ: 1981. pp. 237–246.
    1. Carpenter R.H.S. SPIC: a PC-based system for rapid measurements of saccadic responses. J. Physiol. (Proc.) 1994;480:4.
    1. Clopper C.J, Pearson E.S. The use of confidence or fiducial limits illustrated in the case of the binomial. Biometrika. 1934;26:404–413. doi:10.1093/biomet/26.4.404 - DOI
    1. de Monasterio F.M. Properties of concentrically organized X and Y ganglion cells of macaque retina. J. Neurophysiol. 1978;41:1394–1417. - PubMed
    1. Dorris M.C, Munoz D.P. A neural correlate for the gap effect on saccadic reaction times in monkey. J. Neurophysiol. 1995;73:2558–2562. - PubMed

Publication types

LinkOut - more resources