. 2008 Mar 15;94(6):2115-27.
doi: 10.1529/biophysj.107.113498. Epub 2007 Nov 30.

Oligomerization of membrane-bound diphtheria toxin (CRM197) facilitates a transition to the open form and deep insertion

Affiliations

Oligomerization of membrane-bound diphtheria toxin (CRM197) facilitates a transition to the open form and deep insertion

M S Kent et al. Biophys J. .

Abstract

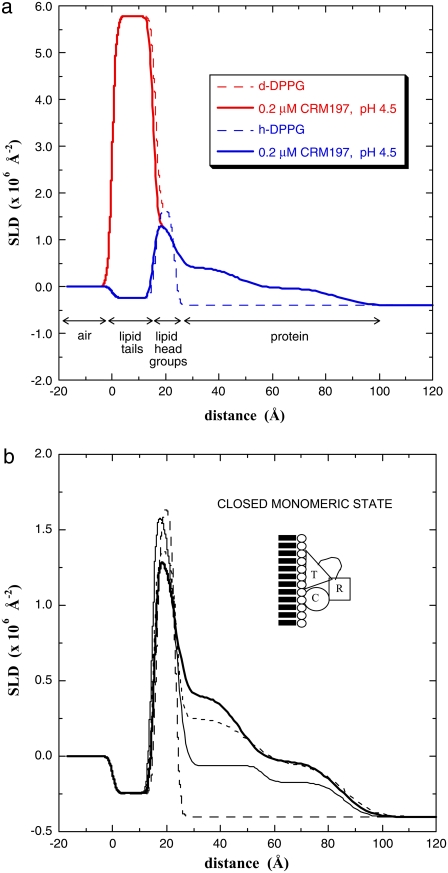
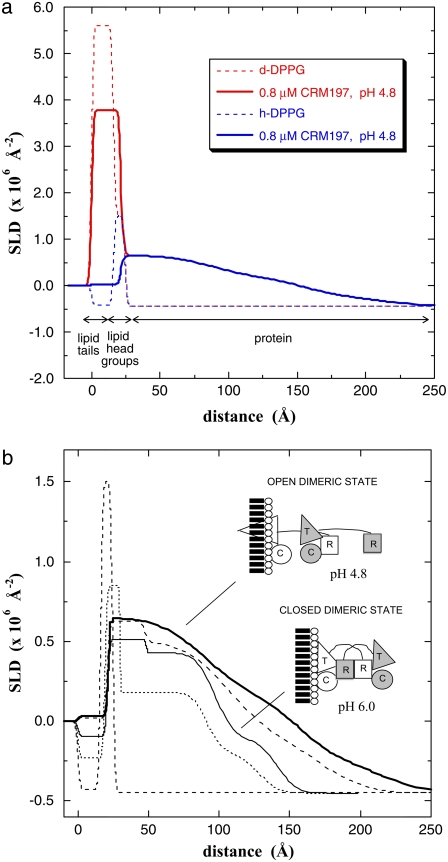
Diphtheria toxin (DT) contains separate domains for receptor-specific binding, translocation, and enzymatic activity. After binding to cells, DT is taken up into endosome-like acidic compartments where the translocation domain inserts into the endosomal membrane and releases the catalytic domain into the cytosol. The process by which the catalytic domain is translocated across the endosomal membrane is known to involve pH-induced conformational changes; however, the molecular mechanisms are not yet understood, in large part due to the challenge of probing the conformation of the membrane-bound protein. In this work neutron reflection provided detailed conformational information for membrane-bound DT (CRM197) in situ. The data revealed that the bound toxin oligomerizes with increasing DT concentration and that the oligomeric form (and only the oligomeric form) undergoes a large extension into solution with decreasing pH that coincides with deep insertion of residues into the membrane. We interpret the large extension as a transition to the open form. These results thus indicate that as a function of bulk DT concentration, adsorbed DT passes from an inactive state with a monomeric dimension normal to the plane of the membrane to an active state with a dimeric dimension normal to the plane of the membrane.


Figures

FIGURE 1
FIGURE 1
(a) Neutron reflectivity for an h-DPPG monolayer alone (x) and after injecting CRM197 at 0.2 μM and reducing the pH to 5.3 (▪), 5.0 (□), and 4.5 (•). These data indicate increased occupancy but little change in the conformation. (b) Neutron reflectivity for an h-DPPG monolayer alone (x) and after injecting CRM197 at 0.8 μM and reducing the pH to 6.5 (▪), 6.0 (•), and 5.4 (□). The increase in peak height from pH 6.5 to 6.0 indicates increased occupancy, whereas the change in the shape of the curve from pH 6.0 to 5.4 indicates a large change in the protein conformation.
FIGURE 2
FIGURE 2
(a) Neutron reflectivity for h-DPPG (□) and d-DPPG (○) monolayers alone and after injecting DT at 0.2 μM and reducing the pH to 4.5 (▪,•). The data for both contrast schemes were fit simultaneously to determine the SLD profile. (b) Neutron reflectivity for h-DPPG (□) and d-DPPG (○) monolayers alone and after injecting CRM197 at 0.8 μM and reducing the pH to 6.0 (▪,•). (c) Neutron reflectivity for h-DPPG (□) and d-DPPG (○) monolayers alone and after injecting CRM197 at 0.8 μM and reducing the pH to 4.8 (▪,•).
FIGURE 3
FIGURE 3
SLD profiles for 0.2 μM CRM197. (a) Profiles for d-DPPG (red line) and h-DPPG (blue line) in the absence of CRM197 (dashed lines) and after injecting CRM197 at 0.2 μM and lowering the pH to 4.5 (solid lines). (b) Profiles for h-DPPG in the absence of CRM197 (dashed line) and after injecting CRM197 at 0.2 μM and lowering the pH to 5.3 (thin solid line), 5.0 (dotted line), and 4.5 (thick solid line). The profiles reveal that little conformational change occurs in CRM197 upon lowering the pH at this bulk concentration. At pH 4.5, the occupancy is ∼34% of a full monolayer of monomeric DT.
FIGURE 4
FIGURE 4
SLD profiles for 0.8 μM CRM197. (a) Profiles for d-DPPG (red lines) and h-DPPG (blue lines) in the absence of CRM197 (dashed lines) and after injecting CRM197 at 0.8 μM and lowering the pH to 4.8 (solid lines). (b) Profiles for h-DPPG in the absence of CRM197 (dashed line) and after injecting CRM197 at 0.8 μM and lowering the pH to 6.5 (dotted line), 6.0 (thin solid line), 5.4 (thick dashed line), and 4.8 (thick solid line). The profiles reveal that, for the dimeric state, CRM197 extends into the subphase and penetrates into the lipid tails upon decrease in pH. At pH 4.8, the occupancy is ∼40% of a full monolayer of dimeric DT.
FIGURE 5
FIGURE 5
SLD profiles for adsorbed CRM197 at 0.2 μM and pH 4.5 (solid line) and at 0.8 μM and pH 6.0 (dashed line). The SLD profiles were derived from simultaneous fitting of the data in Fig. 2, a and b. These profiles are consistent with predominantly monomeric CRM197 at 0.2 μM and mostly dimeric CRM197 at 0.8 μM, illustrated by the diagrams in Figs. 3 b and 4 b. The inset shows calculated volume fraction profiles from crystal structure data for DT in monomeric (1F0L) and dimeric (1DDT) states in the orientations indicated in the diagrams.
FIGURE 6
FIGURE 6
(a) Neutron reflectivity for an h-DPPG monolayer alone (x) and after injecting CRM197 at 0.1 μM and reducing the pH to 5.1 (▪), 4.7 (□), and 4.0 (•). These data indicate increased occupancy but little change in CRM197 conformation. (b) Neutron reflectivity for an h-DPPG monolayer alone (x) and after injecting CRM197 at 0.93 μM and reducing the pH to 6.5 (▪), 6.3 (•), and 5.3 (□). The increase in peak height from pH 6.5 to 6.3 indicates increased occupancy, whereas the change in the shape of the curve from pH 6.3 to 5.3 indicates a large change in protein conformation. (c) NR data for h-DPPG monolayers incubated with 0.93 μM DT CRM197 at various pH values, demonstrating regimes of strong and weak pH dependence. (top panel) NR data for CRM197/h-DPPG at pH 6.3, pH 6.0, and pH 5.8. The data at pH 6.3 are represented as a dashed line. Little change occurs over the pH range 6.0–5.8. (middle panel) NR data for CRM197/h-DPPG at 5.8, pH 5.5, and pH 5.3. The data at pH 5.8 are represented as a dashed line. Little change occurs over the pH range 5.5–5.3. (bottom panel) NR data for CRM197/h-DPPG at pH 5.3, pH 4.9, and pH 4.5. The data at pH 5.3 are represented as a dashed line. Little change occurs over the pH range 4.9–4.5.
FIGURE 7
FIGURE 7
Adsorbed amount versus pH for CRM197 at 0.1 μM (▪), 0.2 μM (•), 0.8 μM (□), and 0.93 μM (○).
FIGURE 8
FIGURE 8
Fractional change in area after addition of CRM197 and lowering the pH for CRM197 concentrations of 0.2 μM (a) and 0.8 μM (b). The sharp increase in area in the latter case indicates a strong insertion of segments into the lipid film at pH 5.4 where the profile extension was first observed by NR. The arrows indicate injections of citric acid and the corresponding pH values.
FIGURE 9
FIGURE 9
(a) Bragg peaks from grazing incidence x-ray diffraction (GIXD) for a h-DPPG monolayer alone at 30 mN/m and after injecting CRM197 at 0.3 μM and reducing the pH to 5.3, 4.9, and 4.2. The two peaks arise from the distorted hexagonal lattice of the DPPG tails in the gel phase. The peaks were relatively unchanged after injecting CRM197 at 0.3 μM and lowering the pH to 4.2, indicating little or no insertion of protein segments into the tails and preservation of the alkyl tail in-plane ordering. (b) Bragg peaks for a h-DPPG monolayer alone and after injecting CRM197 at 0.93 μM and reducing the pH to 5.7 and 5.1. The absence of the peaks after injecting CRM197 and lowering the pH to 5.1 indicates disruption of the in-plane order, suggesting strong insertion of protein segments into the DPPG monolayer.
FIGURE 10
FIGURE 10
(a) XR for a h-DPPG monolayer alone at 30 mN/m (•) and after injecting CRM197 at 0.3 μM and reducing the pH to 4.2 (□). The sharp fringes indicate a laterally uniform film and arise from the elevated electron density of the DPPG headgroups and the total length of the molecule. The fringes were relatively unchanged after injecting CRM197 at 0.3 μM and lowering the pH to 4.2, indicating little or no insertion of protein into the DPPG monolayer. (b). XR for a h-DPPG monolayer alone (•) and after injecting CRM197 at 0.93 μM and reducing the pH to 5.7 (○) and 5.1 (+). The absence of the fringes after injecting CRM197 at 0.93 μM and lowering the pH to 5.1 indicates strong insertion of protein segments into the DPPG monolayer. (c) Expanded view of the low qz region of the data in a. (d) Expanded view of the low qz region of the data in b.
FIGURE 11
FIGURE 11
Normalized electron density profiles for h-DPPG alone (dashed lines) and (a) with CRM197 at 0.3 μM and pH 4.2 (solid line) and (b) with CRM197 at 0.93 μM and pH 5.7 (thin solid line) and pH 5.1 (thick solid line).

References

    1. Chenal, A., P. Nizard, and D. Gillet. 2002. Structure and function of diphtheria toxin: from pathology to engineering. J. Toxicol. Toxin Rev. 21:321–358.
    1. Collier, R. 2001. Understanding the mode of action of diphtheria toxin: a perspective on progress during the 20th century. Toxicon. 39:1793–1803. - PubMed
    1. Sandvig, K., and B. van Deurs. 2002. Membrane traffic exploited by protein toxins. Annu. Rev. Cell Dev. Biol. 18:1–24. - PubMed
    1. Madshus, I. H., and H. Stenmark. 1992. Entry of ADP-ribosylating toxins into cells. Curr. Top. Microbiol. Immunol. 175:1–26. - PubMed
    1. Pappenheimer, A. M. Jr. 1977. Diphtheria toxin. Annu. Rev. Biochem. 46:69–94. - PubMed

Publication types

LinkOut - more resources