. 2008 Mar 15;94(6):2385-403.
doi: 10.1529/biophysj.107.118885. Epub 2007 Nov 30.

Measuring and modeling chloride-hydroxyl exchange in the Guinea-pig ventricular myocyte

Affiliations

Measuring and modeling chloride-hydroxyl exchange in the Guinea-pig ventricular myocyte

S A Niederer et al. Biophys J. .

Abstract

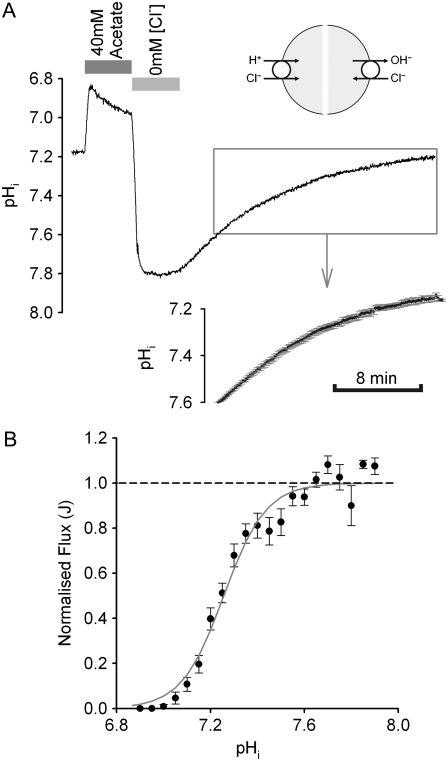
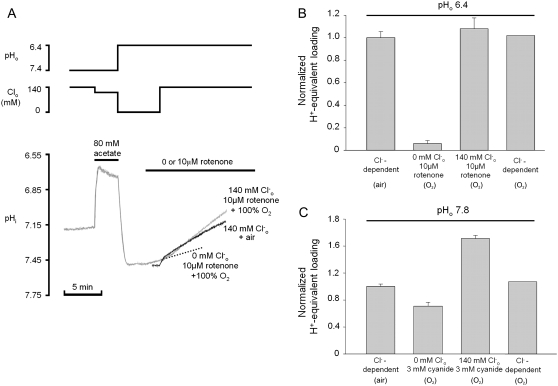
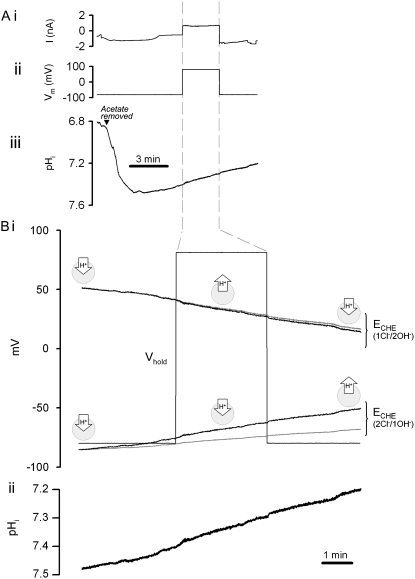
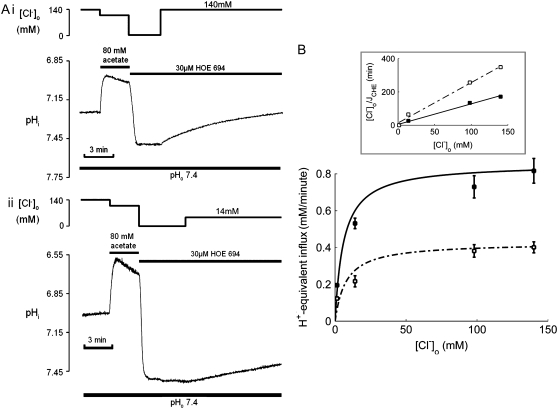
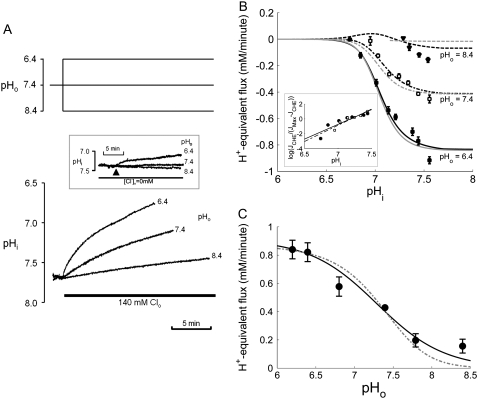
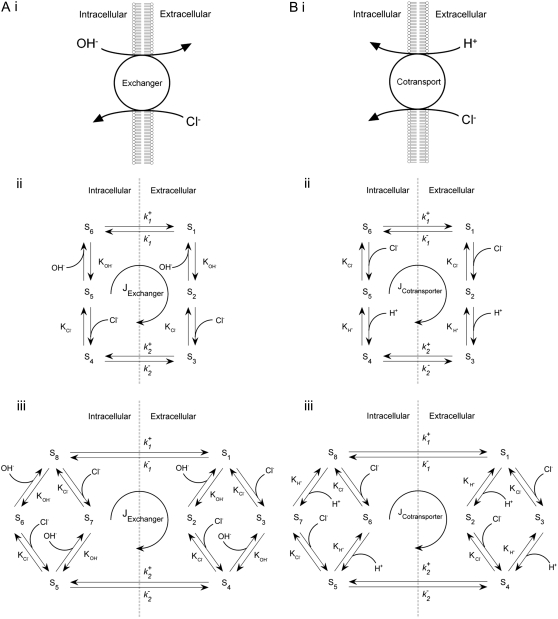
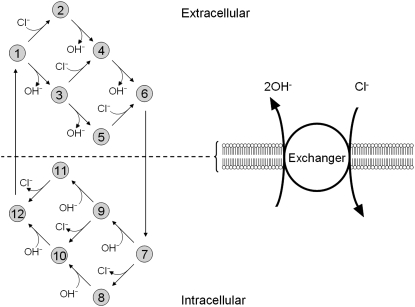
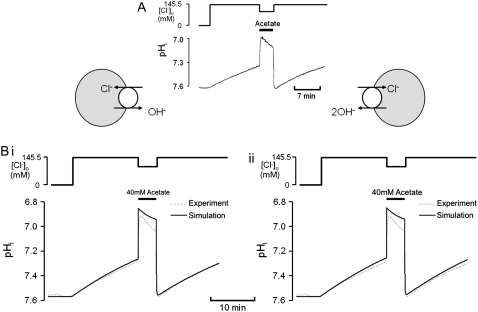
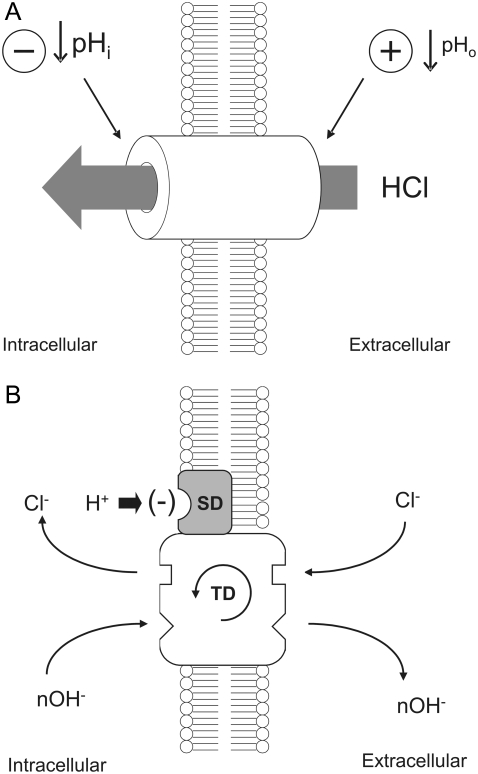
Protons are powerful modulators of cardiac function. Their intracellular concentration is regulated by sarcolemmal ion transporters that export or import H+-ions (or their ionic equivalent: HCO3-, OH-). One such transporter, which imports H+-equivalents, is a putative Cl-/OH- exchanger (CHE). A strong candidate for CHE is SLC26A6 protein, a product of the SLC26A gene family of anion transporters, which has been detected in murine heart. SLC26A6 protein is suggested to be an electrogenic 1Cl-/2OH-(2HCO3-) exchanger. Unfortunately, there is insufficient characterization of cardiac CHE against which the properties of heterologously expressed SLC26A6 can be matched. We therefore investigated the proton, Cl-, and voltage dependence of CHE activity in guinea-pig ventricular myocytes, using voltage-clamp, intracellular pH fluorescence, and mathematical modeling techniques. We find that CHE activity is tightly regulated by intracellular and extracellular pH, is voltage-insensitive over a wide range (+/-80 mV), and displays substrate dependence suggestive of electroneutral 1Cl-/1OH- exchange. These properties exclude electrogenic SLC26A6 as sole contributor to CHE. Either the SLC26A6 product in heart is electroneutral, or CHE comprises at least two transporters with oppositely balanced voltage sensitivity. Alternatively, CHE may comprise an H+-Cl- coinflux system, which cannot be distinguished kinetically from an exchanger. Irrespective of ionic mechanism, CHE's pH sensitivity helps to define resting intracellular pH, and hence basal function in the heart.


Figures

FIGURE 1
FIGURE 1
Stimulating CHE: recovery from alkaline pHi. (A) Experimental protocol illustrating the acetate prepulse technique, used to baseload a guinea-pig ventricular myocyte superfused with Cl-free HEPES-buffered Tyrode's solution. The myocyte is exposed transiently (4 min) to 40 mM sodium acetate. Readmitting formula image then reactivates CHE, permitting pHi to recover to control levels. The upper inset (cartoon) illustrates possible ionic mechanisms. Whole-cell intracellular pH recorded using intracellular, ratiometric SNARF fluorescence. The lower inset shows a portion of the pHi recovery, averaged over the pHi range 7.6–7.2 (n = 15 experiments). (B) Recovery rates for pHi have been converted to values for H+-equivalent influx (see Methods), and plotted versus pHi in the range 7.8–7.0 (n = 9–15 measurements for each point). H+-equivalent influx has been normalized to the peak flux, estimated by fitting the data with a Hill curve. The best-fit (shaded curve) is described by a Hill coefficient of 4.8 and a pK of 7.25.
FIGURE 2
FIGURE 2
formula image independence of CHE activity. (A) Shaded trace: a guinea-pig myocyte is baseloaded (80 mM acetate prepulse) during superfusion with HEPES-buffered, air-equilibrated solution containing 30 μM HOE 694 (to inhibit NHE). On removal of acetate, cell is exposed to Cl-free solution of pH 6.4, and then additionally to 100% O2 and 10 μM rotenone (to create CO2-free conditions). The pHi acidifies slowly (dashed trace). Readdition of 140 mM formula image (to reactivate CHE) stimulates a more rapid acidification. (Solid trace) Different experiment, showing formula image readdition, when superfusates are air-equilibrated, contain 30 μM HOE 694, and lack rotenone. Note that Cl-dependent acidification is comparable in the two traces. (B) Cl-dependent H+-equivalent loading is similar in air and in CO2-free conditions. (Column 1) Cl-dependent H+-equivalent loading in air-equilibrated solutions, estimated from pHi-acidification rates; (column 2) H+-equivalent loading in Cl-free, CO2-free conditions; (column 3) H+-equivalent loading after formula image readdition in CO2-free conditions; and (column 4) Cl-dependent H+-equivalent loading in CO2-free conditions (column 3 minus column 2) (n = 6). H+-equivalent loading in O2 was sampled at pHi 7.4, and normalized to the control Cl-dependent loading measured in air. (C) Cl-dependent H-equivalent loading is similar in air and in O2-equilibrated, CN-containing conditions (30 μM HOE 694 present in superfusates); loading rates sampled at pHi 7.4, and normalized to Cl-dependent rate measured in CN-free, air-equilibrated conditions. A quantity of 3 mM NaCN was added to a baseloaded myocyte bathed in Cl-free 100% O2-equilibrated solution of pH 7.8 (column 2); formula image readdition prompted a larger H+-equivalent loading (column 3); Cl-dependent H+-equivalent loading in 100% O2/CN (column 4) is comparable to Cl-dependent loading measured in CN-free, air-equilibrated conditions (column 1) (n = 6).
FIGURE 3
FIGURE 3
Voltage independence of CHE activity. (A) A guinea-pig myocyte, in a nominally CO2-free HEPES-buffered Tyrode solution, was voltage-clamped in whole-cell, ruptured-patch configuration, while pHi was monitored simultaneously. The myocyte was baseloaded by an 8 min prepulse with 40 mM acetate. During recovery of pHi from the baseload, holding potential (Vhold) was depolarized from −80 mV to +80 mV for a period of 3 min. (i) Current injected into myocyte, (ii) membrane potential, (iii) pHi. (B). (i) Timecourse of holding potential (Vhold) and predicted reversal potentials (ECHE) for two putative forms of electrogenic CHE transport, 2Cl/1OH and 1Cl/2OH, plotted assuming constant [Cl]i of 30 mM, equal to pipette-filling solution [Cl] (shaded trace), or assuming that [Cl] rises over time from 30 mM, due to CHE activity (solid trace); [Cl]i rising by 2.6 and 10.6 mM for Cl/2OH and 2Cl/OH, respectively. Inward and outward H+-flux icons represent thermodynamically predicted direction of carrier activity. (ii) pHi recovery from alkaline pHi, replotted at higher amplification from panel Aiii, showing lack of effect of membrane potential on timecourse of pHi recovery (compare this to the direction of pHi change expected from individual electrogenic transporters, see icons). Similar results were obtained in four other experiments.
FIGURE 4
FIGURE 4
[Cl]o-dependence of CHE activity. (A) Recovery of pHi was measured after readdition of (i) 140 mM or (ii) 14mM Cl, after an acetate prepulse performed to baseload a guinea-pig myocyte in a nominally CO2-free HEPES-buffered Tyrode solution. HOE 694 (30 μM) was included to block Na+-H+ exchange during Cl-activated pHi recovery. Superfusate pHo was maintained at 7.4. (B) The timecourses of pHi recovery were converted to H+-equivalent influx computed at pHi = 7.5–7.55, and plotted as a function of [Cl]o (1.4, 14, 100, 140 mM). Measurements (n = 6) were performed on experiments at pHo 7.4 (open symbols) or 6.4 (solid symbols). Flux values are derived from the initial rate of recovery of pHi, when [Cl]i is close to zero. Data were best-fitted with Hill curves with cooperativity 0.76 and 0.85 for pHo 7.4 and 6.4, respectively. (Inset) A Hanes plot demonstrates that changing pHo has a significant effect on Vmax (slope−1) and only a modest effect on Km (intercept) for formula image
FIGURE 5
FIGURE 5
pHi- and pHo-dependence of CHE activity. (A) Recovery of pHi was measured after readdition of 140 mM Cl at pHo 6.4, 7.4, or 8.4, after an acetate prepulse performed to baseload a guinea-pig myocyte in a nominally CO2-free HEPES-buffered Tyrode's solution. Thirty-micrometers HOE 694 was included to block Na+-H+ exchange during Cl-activated pHi recovery. (Inset) pHi timecourses measured in the absence of formula image at three pHo values. The arrow indicates the time of the change of pHo. (B) The timecourses of pHi recovery were converted to H+-equivalent flux, calculated over the pHi range 6.8–7.6 for pHo 6.4 (solid squares), 7.4 (open squares), and 8.4 (solid triangles). Cl-independent flux was subtracted from the data. The data were fitted with models for electroneutral CHE (solid curves) or 1Cl/2OH electrogenic CHE (shaded curves). (Inset) a Hill plot of data measured at pHo 7.4 (solid squares) and 6.4 (open squares) fitted with Hill coefficients of 4.37 and 3.97. (C) measurements of H+-equivalent influx plotted as a function of pHo, estimated at a common pHi of 7.69. The data were fitted with model of electroneutral CHE (solid curve) or 1Cl/2OH electrogenic CHE (dashed curve).
FIGURE 6
FIGURE 6
Schematic diagrams for six- and eight-state kinetic CHE models. Kinetic diagrams: Cl/OH exchanger models (A, left panels) and H+-Cl cotransporter models (B, right panels). Cartoons for (Ai) Cl/OH exchange and (Bi) H+-Cl cotransport. Schematics of six-state scheme for (Aii) Cl/OH exchange and (Bii) H+-Cl cotransport and eight-state scheme for (Aiii) Cl/OH exchange and (Biii) H+-Cl cotransport. The circular arrows denote direction of net transporter activity. Transition between different conformational states (s1–s6 or s1–s8) of the transporter is indicated by the straight arrows. Ion binding or unbinding to various states is indicated by the curved lines that merge with the transition arrows. The equilibrium constant for each ion binding and unbinding is represented by the parameters KCl, KOH, and KH for the respective ions.
FIGURE 7
FIGURE 7
Schematic diagram for the 12-state kinetic CHE model. Twelve-state schematic diagram (left panel) for electrogenic Cl/2OH exchange (cartoon in right panel, denoting net direction of transmembrane operation of transporter). The12-state model contains three independent binding sites, two for binding OH ions and one for Cl. The binding affinities are independent of the carrier conformation and number of ions bound. The model does not distinguish between the two OH binding sites, which both have the same binding affinity. Transitions 1–6 occur when binding sites are exposed to the extracellular compartment. Transitions 7–12 occur when binding sites are exposed to the intracellular compartment. Transitions from consecutive odd- to even-numbered states (e.g., S1 to S2) involve Cl binding/unbinding. Transitions between consecutive even-numbered states (e.g., S2 to S4) or between consecutive odd-numbered (e.g., S1 to S3) states on the same side of the membrane involve OH binding/unbinding. Rate constants and binding affinities have been omitted for clarity.
FIGURE 8
FIGURE 8
Modeling pHi changes induced by CHE activity. (A) pHi timecourse measured experimentally, showing pHi recovery from intracellular baseload induced first by readdition of formula image followed by a subsequent 40 mM acetate prepulse and another pHi recovery from the baseload (trace taken from Fig. 3 of (7)). (B) Model simulations (solid traces) of the experiment shown in panel A, based on (i) electroneutral Cl/OH exchange (eight-state model; see Fig. 6 Aiii) or (ii) electrogenic Cl/2OH exchange (12-state model; see Fig. 7). The experimental timecourse has been superimposed (dashed trace in Bi and Bii).
FIGURE 9
FIGURE 9
Schematic diagrams of CHE. (A) CHE acts, in effect, as a leak of hydrochloric acid into the cardiac cell, regulated by pHi (low pH inhibitory) and pHo (low pH excitatory). (B) CHE represented as Cl/OH exchange, showing separate transport binding sites for intracellular and extracellular Cl and OH (n = 1,2) ions, positioned on the transport domain (TD) of the carrier. Ion transport is also regulated by a proton-binding, allosteric controller (the proton sensor domain, SD) positioned on the intracellular face of the protein. Proton binding to the SD inhibits carrier activity.

Similar articles

Cited by

References

    1. Choi, H. S., A. W. Trafford, C. H. Orchard, and D. A. Eisner. 2000. The effect of acidosis on systolic Ca2+ and sarcoplasmic reticulum calcium content in isolated rat ventricular myocytes. J. Physiol. 529:661–668. - PMC - PubMed
    1. Bountra, C., and R. Vaughan-Jones. 1989. Effect of intracellular and extracellular pH on contraction in isolated, mammalian cardiac muscle. J. Physiol. 418:163–187. - PMC - PubMed
    1. Komukai, K., F. Brette, C. Pascarel, and C. H. Orchard. 2002. Electrophysiological response of rat ventricular myocytes to acidosis. Am. J. Physiol. Heart Circ. Physiol. 283:H412–H422. - PubMed
    1. Leem, C. H., D. Lagadic-Gossmann, and R. D. Vaughan-Jones. 1999. Characterization of intracellular pH regulation in the guinea-pig ventricular myocyte. J. Physiol. 517:159–180. - PMC - PubMed
    1. Poole, R. C., and A. P. Halestrap. 1993. Transport of lactate and other monocarboxylates across mammalian plasma membranes. Am. J. Physiol. Cell Physiol. 264:C761–C782. - PubMed

Publication types

LinkOut - more resources