. 2007 Nov;19(11):3578-92.
doi: 10.1105/tpc.107.054890. Epub 2007 Nov 30.

Cell-fate switch of synergid to egg cell in Arabidopsis eostre mutant embryo sacs arises from misexpression of the BEL1-like homeodomain gene BLH1

Affiliations

Cell-fate switch of synergid to egg cell in Arabidopsis eostre mutant embryo sacs arises from misexpression of the BEL1-like homeodomain gene BLH1

Gabriela Carolina Pagnussat et al. Plant Cell. 2007 Nov.

Abstract

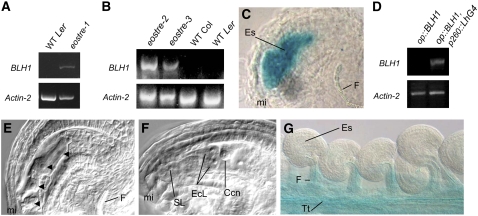
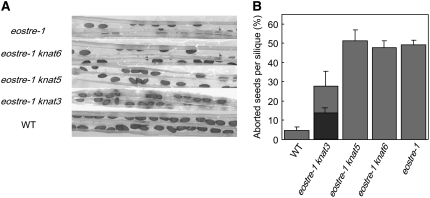
In Arabidopsis thaliana, the female gametophyte is a highly polarized structure consisting of four cell types: one egg cell and two synergids, one central cell, and three antipodal cells. In this report, we describe the characterization of a novel female gametophyte mutant, eostre, which affects establishment of cell fates in the mature embryo sac. The eostre phenotype is caused by misexpression of the homeodomain gene BEL1-like homeodomain 1 (BLH1) in the embryo sac. It is known that BELL-KNAT proteins function as heterodimers whose activities are regulated by the Arabidopsis ovate family proteins (OFPs). We show that the phenotypic effect of BLH1 overexpression is dependent upon the class II knox gene KNAT3, suggesting that KNAT3 must be expressed and functional during megagametogenesis. Moreover, disruption of At OFP5, a known interactor of KNAT3 and BLH1, partially phenocopies the eostre mutation. Our study indicates that suppression of ectopic activity of BELL-KNOX TALE complexes, which might be mediated by At OFP5, is essential for normal development and cell specification in the Arabidopsis embryo sac. As eostre-1 embryo sacs also show nuclear migration abnormalities, this study suggests that a positional mechanism might be directing establishment of cell fates in early megagametophyte development.


Figures

Figure 1.
Figure 1.
eostre Embryo Sacs Show Two Egg Cells and Only One Synergid Cell. (A) Differential interference contrast (DIC) image showing a wild-type embryo at stage FG7. Nuclei have been artificially colored in red. (B) Scheme indicating the different cell types present in a wild-type embryo sac at stage FG7. (C) DIC image showing eostre mutant embryo sac phenotype at FG7. Nuclei have been artificially colored in red. (D) Scheme indicating the cells that morphologically resemble egg cells and synergid cells in eostre mutant embryo sacs. (E) Expression of the specific egg cell marker ET1119 in a wild-type embryo sac. (F) The egg cell marker ET1119 is expressed in two micropylar cells in eostre embryo sacs. (G) Distribution of ovules showing different ET1119 expression patterns in eostre-1/EOSTRE pistils. Error bars indicate se (n = 168). The white bar represents the percentage of ovules showing no GUS staining. The bar labeled “Gus (+) 1 Ec” represents the percentage of ovules showing GUS expression in only one cell of the embryo sac. The bar labeled “Gus (+) 2 Ec” represents the percentage of ovules showing GUS expression in two cells of the embryo sac. When ovules from wild-type pistils were analyzed, GUS staining was always detected in only one micropylar cell. Out of 264 observed, 47.8% of the ovules showed GUS staining. (H) Expression of the specific synergid cell marker ET884 in a wild-type embryo sac. (I) The synergid cell marker ET884 is expressed in only one micropylar cell in eostre embryo sacs. (J) Distribution of ovules showing different ET884 expression patterns in eostre-1/EOSTRE pistils. Error bars indicate se (n = 127). The white bar represents the percentage of ovules showing no GUS staining. The bar labeled “Gus (+) 1 syn” represents the percentage of ovules showing GUS expression in only one cell of the embryo sac. The bar labeled “Gus (+) 2 syn” represents the percentage of ovules showing GUS expression in two cells of the embryo sac. When ovules from wild-type pistils where analyzed, GUS staining was detected in two micropylar cells in 46.8% of the ovules observed and in only one of the micropylar cells in 1.1% of the ovules (n = 247). Ccn, central cell nucleus; Ec, egg cell; EcL, egg cell–like cell; mi, micropylar pole; S, synergide; Slc, synergid-like cell.
Figure 2.
Figure 2.
Functional Study of Egg Cells and Synergids in eostre Embryo Sacs. (A) Abnormal pollen tube growth patterns observed at the micropyle of an eostre mutant ovule. (B) Pollen tube growing toward the micropyle of a wild-type embryo sac present in the pistil of eostre-1/EOSTRE plants. (C) eostre embryo sac after fertilization showing one zygote-like cell, an egg cell–like cell, and endosperm development (endosperm nuclei are indicated by arrowheads). (D) eostre embryo sac after fertilization showing two zygote-like cells and no endosperm development. (E) to (H) GUS expression in both wild-type ([E] and [G]) and eostre ([F] and [H]) ovules after an eostre-1/EOSTRE plant was pollinated with a transgenic plant carrying the PFAC1IE:GFP-GUS:TFAC1 construct. (E) GUS expression observed in the zygote of a wild-type ovule. (F) GUS expression observed in both of the zygote-like cells present in this eostre embryo sac. (G) GUS expression observed in the embryo and in the endosperm of a wild-type ovule. (H) GUS expression observed in one zygote-like cell and in the endosperm of an eostre embryo sac. The arrows point at endosperm nuclei. Ec, egg cell; EcL, egg cell–like cell; En, endosperm; EP, embryo proper; F, funiculus; mi, micropylar pole; PT, pollen tube; Z, zygote; ZL, zygote like.
Figure 3.
Figure 3.
Wild-Type and eostre Female Gametophyte Development in Arabidopsis. (A) Scheme showing the developmental stages leading to the wild-type embryo sac formation. (B) Wild-type embryo sac at FG3 stage, showing two nuclei separated by a vacuole. (C) Wild-type embryo sac at FG4 stage, showing two pairs of nuclei separated by a vacuole. (D) Eight-nucleated wild-type embryo sac. One of the chalazal end nuclei is migrating toward the micropylar end (indicated by arrows). (E) Wild-type embryo sac containing seven cells and eight nuclei. (F) Wild-type embryo sac containing seven cells and seven nuclei. (G) Scheme showing the developmental stages leading to the eostre mutant female gametophyte formation. (H) eostre embryo sac at FG3 stage, showing two nuclei separated by a small vacuole. (I) eostre embryo sac at FG4 stage. The vacuole is positioned on a side of the embryo sac, the two pairs of nuclei are not completely separated, and they look aligned along the embryo sac. (J) eostre embryo sac at FG5 stage showing an atypical arrangement of nuclei at the micropylar end. One of the chalazal end nuclei is migrating toward the micropylar end (indicated by arrows). (K) eostre embryo sac containing seven cells and eight nuclei. eostre embryo sacs appear to contain two egg cells instead of one and only one synergid cell. (L) eostre embryo sac at FG7 stage. Nuclei have been artificially colored in red. Cc, central cell; Ccn, central cell nucleus; Ch, chalazal pole; Ec, egg cell; EcL, egg cell–like cell; mi, micropylar pole; Pn, polar nuclei; S, synergide; SL, synergid-like cell.
Figure 4.
Figure 4.
The eostre Mutant Phenotype Is Caused by a Ds Insertion within the Intergenic Region between the Genes At2g35940 and At2g35950. (A) Position of the Ds element in eostre-1 and of the T-DNA insertion in eostre-2 and eostre-3. The arrow indicates the GUS gene within the Ds insertion. The Ds insertion is located 11,272 bp upstream of the At2g35940 (BLH1) start codon. (B) DIC image showing eostre-2 mutant embryo sac phenotype at FG7. (C) DIC image showing eostre-3 mutant embryo sac phenotype at FG7. (D) Phenotype of an eostre-2/EOSTRE silique. The insert shows an enlarged section of the silique, and the arrow points to an aborted ovule. (E) Phenotype of an eostre-3/EOSTRE silique. The insert shows an enlarged section of the silique, and the arrowhead points to an aborted ovule. Ccn, central cell nucleus; EcL, egg cell–like cell; mi, micropylar pole of the embryo sac; SL, synergid-like cell.
Figure 5.
Figure 5.
Misexpression of BLH1 in the Embryo Sac Recapitulates the eostre Phenotype. (A) RT-PCR showing BLH1 overexpression and actin expression as a positive control (bottom) in eostre-1 ovules. (B) Overexpression of BLH1 was also observed in eostre-2 and eostre-3 ovules in the Col background. Actin expression is shown as a positive control (bottom). (C) GUS staining pattern in a pES1BLH1 ovule showing that pES1 specifically directs expression of the reporter genes to the female gametophyte. (D) BLH1 expression in pES1BLH1 ovules detected by RT-PCR. Actin expression is shown as a positive control (bottom). (E) Phenotype of a pES1BLH1 embryo sac at FG4 stage. Arrowheads indicate the unusual position of nuclei. (F) Phenotype of a pES1BLH1 embryo sac at FG7 stage. (G) Expression pattern of BLH1 in the pistil of the BLH1 gene trap line GT9784. Ccn, central cell nucleus; EcL, egg cell–like cell; Es, embryo sac; F, funiculus; mi, micropylar pole of the embryo sac; SL, synergid-like cell; Tt, transmitting track.
Figure 6.
Figure 6.
A Mutation in the Class II Knox Gene KNAT3 Suppresses the eostre Phenotype. (A) Mature siliques of eostre-1/EOSTRE plants and double mutants eostre1 knat6, eostre1 knat5, and eostre1 knat3. The bottom panel shows a mature silique of the wild type. (B) The aborted seeds per silique were quantified for each genetic background. Values represent average number of aborted seeds per silique (mean ± se, n = 20). Light-gray bars correspond to ovules from plants heterozygous for the insertion in knox genes. The dark-gray bar shows data corresponding to ovules from plants that were homozygous for the insertion in the knat-3 gene.
Figure 7.
Figure 7.
At OFP5, an Interactor of BLH1 and KNAT3, Is Required for Normal Embryo Sac Development. (A) At OFP5-1 mutant embryo sac at FG7 showing a phenotype similar to the one observed in eostre-1 ovules. (B) RT-PCR showing KNAT3 expression in wild-type, eostre-1, and spl ovules. Actin expression is also shown as a positive control (bottom). The picture corresponds to 20 PCR cycles. (C) RT-PCR showing At OFP5 expression in wild-type and spl ovules. Actin expression is shown as a positive control (bottom). The picture corresponds to 20 PCR cycles. At OFP5 expression was detected in spl ovules after 25 PCR cycles. (D) RT-PCR showing BLH1 expression in wild-type and eostre-1 leaves. The picture corresponds to 25 PCR cycles. BLH1 expression was detected in wild-type leaves at 30 cycles. (E) RT-PCR showing KNAT3 expression in wild-type and eostre-1 leaves. The picture corresponds to 25 PCR cycles. Ccn, central cell nucleus; EcL, egg cell–like cell; mi, micropylar pole of the embryo sac; SL, synergid-like cell.

Similar articles

Cited by

References

    1. Adai, A., Johnson, C., Mlotshwa, S., Archer-Evans, S., Manocha, V., Vance, V., and Sundaresan, V. (2005). Computational prediction of miRNAs in Arabidopsis thaliana. Genome Res. 15 78–91. - PMC - PubMed
    1. Adler, R. (2000). A model of retinal cell differentiation in the chick embryo. Prog. Retin. Eye Res. 19 529–557. - PubMed
    1. Alonso, J.M., et al. (2003). Genome-wide Insertional mutagenesis of Arabidopsis thaliana. Science 301 653–657. - PubMed
    1. Bellaoui, M., Pidkowich, M.S., Samach, A., Kushalappa, K., Kohalmi, S.E., Modrusan, Z., Crosby, W.L., and Haughn, G.W. (2001). The Arabidopsis BELL1 and KNOX TALE homeodomain proteins interact through a domain conserved between plants and animals. Plant Cell 13 2455–2470. - PMC - PubMed
    1. Betschinger, J., and Knoblich, J.A. (2004). Dare to be different: Asymmetric cell division in Drosophila, C. elegans and vertebrates. Curr. Biol. 14 R674–R685. - PubMed

Publication types

MeSH terms