. 2007 Dec 15;21(24):3244-57.
doi: 10.1101/gad.1588507. Epub 2007 Nov 30.

Motif module map reveals enforcement of aging by continual NF-kappaB activity

Affiliations

Motif module map reveals enforcement of aging by continual NF-kappaB activity

Adam S Adler et al. Genes Dev. .

Abstract

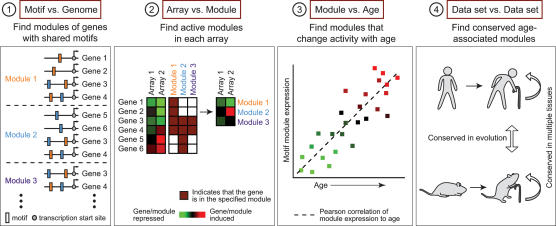
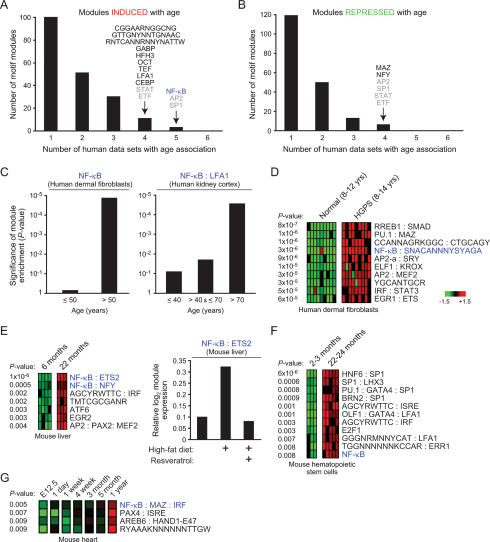
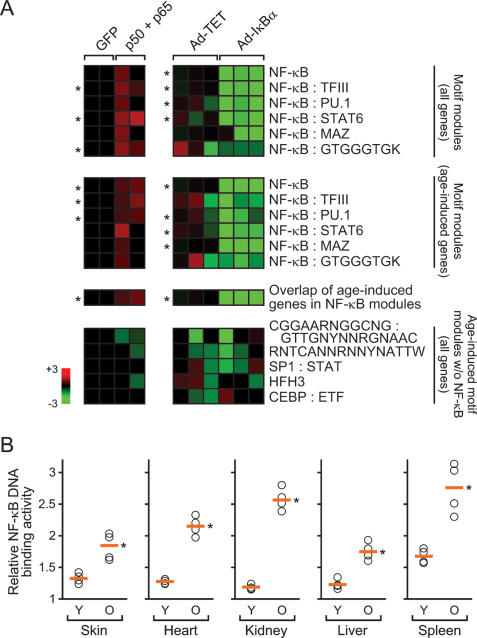
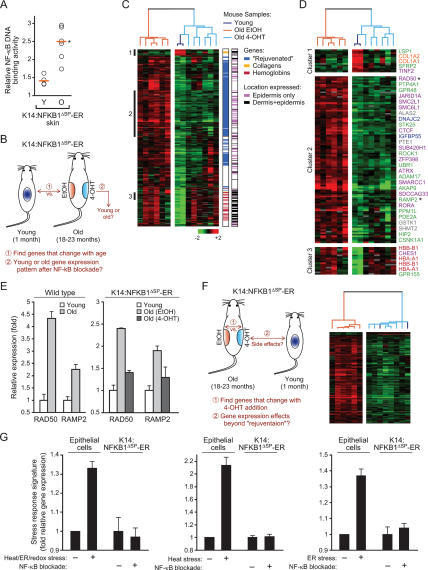
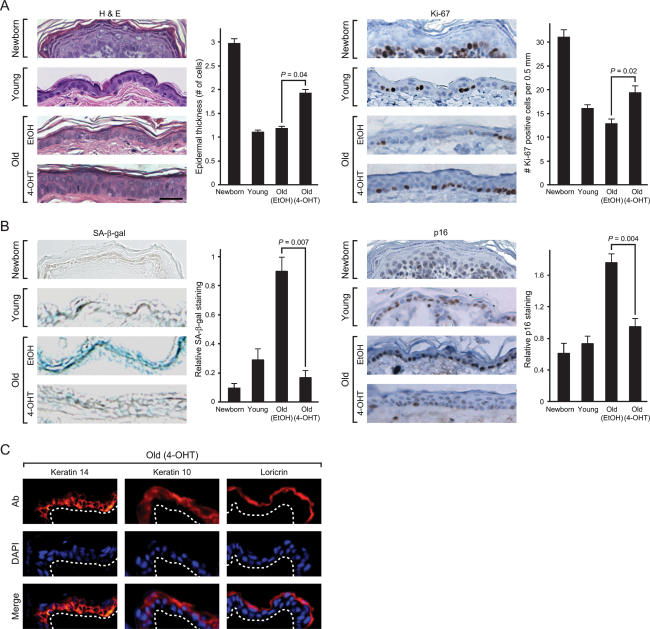
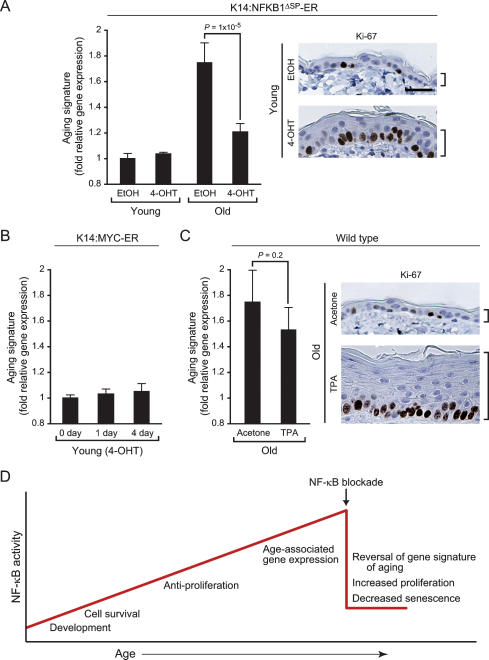
Aging is characterized by specific alterations in gene expression, but their underlying mechanisms and functional consequences are not well understood. Here we develop a systematic approach to identify combinatorial cis-regulatory motifs that drive age-dependent gene expression across different tissues and organisms. Integrated analysis of 365 microarrays spanning nine tissue types predicted fourteen motifs as major regulators of age-dependent gene expression in human and mouse. The motif most strongly associated with aging was that of the transcription factor NF-kappaB. Inducible genetic blockade of NF-kappaB for 2 wk in the epidermis of chronologically aged mice reverted the tissue characteristics and global gene expression programs to those of young mice. Age-specific NF-kappaB blockade and orthogonal cell cycle interventions revealed that NF-kappaB controls cell cycle exit and gene expression signature of aging in parallel but not sequential pathways. These results identify a conserved network of regulatory pathways underlying mammalian aging and show that NF-kappaB is continually required to enforce many features of aging in a tissue-specific manner.


Figures

Figure 1.
Figure 1.
Motif module map of mammalian aging. (Step 1) Modules of genes that share upstream regulatory sequence motifs are identified. For instance, module 1 consists of all genes with the orange motif, module 2 is the set of all genes with the blue motif, and module 3 is the set of all genes with both orange and blue motifs. (Step 2) The average expression of motif module induction or repression in each microarray gene expression profile is determined; red represents module induction, and green represents module repression. (Step 3) Identification of motif modules that show an age-associated increase (or decrease, not shown) in expression (P < 0.01, one-sided t-test). (Step 4) Conservation of age-associated motifs in multiple tissues and in species identifies candidate general regulators of mammalian aging.
Figure 2.
Figure 2.
Identification of NF-κB as a regulator of aging-associated gene expression programs. (A,B) Modules induced or repressed with age. Shown is the number of constituent motif modules that are induced (A) or repressed (B) with age in the indicated number of human tissues. Motifs overlapping in four or five human tissues are shown; motifs labeled in gray were found to be both induced and repressed with age in combination with different motifs. NF-κB-containing motif modules are labeled blue throughout the figure. (C) NF-κB module expression increases with chronologic age. Shown is the significance (P-value, hypergeometric distribution) of the fraction of tissue samples within each age group that demonstrates activation of the indicated module. (D) Shown are motif modules significantly induced in Hutchinson Guilford progeria syndrome fibroblasts (P-value, Student’s t-test). Each row is a motif module; each column is a microarray sample. (E, left) Motif module expression in mouse liver. Only modules with P < 0.01 are shown (Student’s t-test). (Right) Relative expression of NF-κB:ETS2 module in mouse liver after the indicated treatments. (F) Motif module expression in mouse haematopoietic stem cells (P < 0.01, Student’s t-test). (G) Motif module expression over time in mouse heart (P < 0.01, one-sided t-test).
Figure 3.
Figure 3.
Experimental validation of NF-κB motif modules with age. (A) NF-κB-containing motif modules are experimentally responsive to altered NF-κB activity. Each row represents a motif module composed of the indicated genes (the last row represents the overlap of all age-associated genes); each column represents an experiment. Each square is the average expression value of genes in the indicated motif module. NF-κB modules are specifically induced by p50 and p65 expression in primary human keratinocytes (left) and repressed by IκBα expression in primary human fibroblasts (right). (*) P < 0.05 between experimental treatment and control, Student’s t-test. (B) NF-κB DNA-binding activity increase with age in mouse tissue. Shown is the relative level of NF-κB DNA-binding activity in the indicated organ of young (Y; 1 mo) and old (O; 22 mo) wild-type mice. Orange line indicates the average activity. (*) P < 0.005 between young and old for each organ, Student’s t-test.
Figure 4.
Figure 4.
“Rejuvenation” of age-associated gene expression program upon NF-κB blockade in vivo. (A) NF-κB DNA-binding activity in the skin of K14:NFKB1ΔSP-ER mice increase with age. Orange line indicates the average activity. (*) P = 0.004, Student’s t-test. (B) Schematic of the analysis to identify the fraction of age-associated genes that changes with NF-κB blockade. (C) NF-κB blockade “rejuvenates” age-regulated genes in the epidermis. Expression pattern of 414 genes that changed with age was used to organize all samples (young, old plus EtOH, old plus 4-OHT) by unsupervised hierarchical clustering. (Right) First bar indicates the location of “rejuvenated,” collagen, or hemoglobin genes; second bar indicates the layer-specific expression of each gene in murine skin (April and Barsh 2006). (D) Gene clusters highlighted in C are enlarged. Genes enriched for specific cellular processes are shown (green, protein modification/signal transduction; purple, chromatin/transcriptional regulation; blue, cell cycle/growth control; gray, mitochondrion; orange, collagens; red, hemoglobins). (*) Genes whose expression was verified by qRT–PCR. (E) qRT–PCR validation of age-dependent induction of two aging signature genes in wild-type and K14:NFKB1ΔSP-ER mice. (F, left) Schematic of the analysis to identify expression effects beyond “rejuvenation” upon 4-OHT addition. (Right) NF-κB blockade through 4-OHT addition only induced gene expression patterns seen in young skin. Expression pattern of 276 genes that changed with 4-OHT treatment in old skin was used to organize all samples by unsupervised hierarchical clustering. Note that the two young samples are intermixed with old 4-OHT-treated samples in the dendrogram. (G) NF-κB blockade in old skin does not induce transcriptional signatures of cell stress. Shown is the average relative gene expression (±SD) of all genes that comprise the transcriptional signatures in response to heat, ER (tunicamycin or DTT), or redox (menadione) stresses (left); all genes in response to heat alone (middle); or all genes in response to ER stress alone (right) in epithelial cells (Murray et al. 2004) and the average expression of these genes in old K14:NFKB1ΔSP-ER mice with and without NF-κB blockade.
Figure 5.
Figure 5.
Reversal of tissue characteristics of epidermal aging by NF-κB blockade. (A) NF-κB inhibition increases epidermal thickness and proliferation. (Left) Hematoxylin and eosin (H&E) staining of mouse epidermis. Average epidermal thickness (number of cell layers) is shown (±SEM). P-values show significant difference between old EtOH and old 4-OHT (Student’s t-test). Bar, 30 μm. (Right) Immunohistochemistry of Ki-67 protein expression in the epidermis of paraffin-embedded sections is shown (average number of Ki-67-positive cells ± SEM). (B) NF-κB blockade decreases senescence markers SA-β-gal and p16INK4A. (Left) SA-β-gal activity in the epidermis of frozen sections is shown (average SA-β-gal activity on a 0–3 scale ± SEM). (Right) Immunohistochemistry of p16INK4A protein in paraffin-embedded sections is shown (average p16INK4A staining on a 0–3 scale ± SEM). (C) Immunofluorescence of K14, K10, and loricrin (Ab, red) in frozen sections of old skin after NF-κB blockade. Nuclei are blue with DAPI counterstain. White dashed line indicates basement membrane.
Figure 6.
Figure 6.
NF-κB controls cell cycle exit and gene expression signature of aging in parallel but not in sequential pathways. (A) NF-κB inhibition in young mice induces epidermal proliferation without affecting gene expression signature of aging. (Left) Average relative gene expression (±SD) of the aging signature (genes that are induced by age and reversed by NF-κB blockade from Fig. 4C) in young and old K14:NFKB1ΔSP-ER mice. P-value shows significant difference between old EtOH and old 4-OHT (Student’s t-test). (Right) Ki-67 protein expression and epidermal thickness before and after 4-OHT treatment. Bar, 30 μm. (B) Enforced cell cycle entry by MYC does not induce the aging signature. Shown is the average relative gene expression (±SD) of the aging signature 1 or 4 d after 4-OHT treatment in young K14:MYC-ER mice. (C) TPA-enforced hyperproliferation in old skin has little effect on the aging signature. Gene expression and Ki67 staining are as above. (D) Model of NF-κB action in aging. Accumulation of NF-κB activity with age imparts additional layers of age-specific functions. Upon NF-κB blockade in aged tissue, multiple features characteristic of aging are reversed.

References

    1. April C.S., Barsh G.S., Barsh G.S. Skin layer-specific transcriptional profiles in normal and recessive yellow (Mc1re/Mc1re) mice. Pigment Cell Res. 2006;19:194–205. - PubMed
    1. Arkan M.C., Hevener A.L., Greten F.R., Maeda S., Li Z.W., Long J.M., Wynshaw-Boris A., Poli G., Olefsky J., Karin M., Hevener A.L., Greten F.R., Maeda S., Li Z.W., Long J.M., Wynshaw-Boris A., Poli G., Olefsky J., Karin M., Greten F.R., Maeda S., Li Z.W., Long J.M., Wynshaw-Boris A., Poli G., Olefsky J., Karin M., Maeda S., Li Z.W., Long J.M., Wynshaw-Boris A., Poli G., Olefsky J., Karin M., Li Z.W., Long J.M., Wynshaw-Boris A., Poli G., Olefsky J., Karin M., Long J.M., Wynshaw-Boris A., Poli G., Olefsky J., Karin M., Wynshaw-Boris A., Poli G., Olefsky J., Karin M., Poli G., Olefsky J., Karin M., Olefsky J., Karin M., Karin M. IKK-β links inflammation to obesity-induced insulin resistance. Nat. Med. 2005;11:191–198. - PubMed
    1. Baur J.A., Pearson K.J., Price N.L., Jamieson H.A., Lerin C., Kalra A., Prabhu V.V., Allard J.S., Lopez-Lluch G., Lewis K., Pearson K.J., Price N.L., Jamieson H.A., Lerin C., Kalra A., Prabhu V.V., Allard J.S., Lopez-Lluch G., Lewis K., Price N.L., Jamieson H.A., Lerin C., Kalra A., Prabhu V.V., Allard J.S., Lopez-Lluch G., Lewis K., Jamieson H.A., Lerin C., Kalra A., Prabhu V.V., Allard J.S., Lopez-Lluch G., Lewis K., Lerin C., Kalra A., Prabhu V.V., Allard J.S., Lopez-Lluch G., Lewis K., Kalra A., Prabhu V.V., Allard J.S., Lopez-Lluch G., Lewis K., Prabhu V.V., Allard J.S., Lopez-Lluch G., Lewis K., Allard J.S., Lopez-Lluch G., Lewis K., Lopez-Lluch G., Lewis K., Lewis K., et al. Resveratrol improves health and survival of mice on a high-calorie diet. Nature. 2006;444:337–342. - PMC - PubMed
    1. Bernard D., Gosselin K., Monte D., Vercamer C., Bouali F., Pourtier A., Vandenbunder B., Abbadie C., Gosselin K., Monte D., Vercamer C., Bouali F., Pourtier A., Vandenbunder B., Abbadie C., Monte D., Vercamer C., Bouali F., Pourtier A., Vandenbunder B., Abbadie C., Vercamer C., Bouali F., Pourtier A., Vandenbunder B., Abbadie C., Bouali F., Pourtier A., Vandenbunder B., Abbadie C., Pourtier A., Vandenbunder B., Abbadie C., Vandenbunder B., Abbadie C., Abbadie C. Involvement of Rel/nuclear factor-κB transcription factors in keratinocyte senescence. Cancer Res. 2004;64:472–481. - PubMed
    1. Borneman A.R., Leigh-Bell J.A., Yu H., Bertone P., Gerstein M., Snyder M., Leigh-Bell J.A., Yu H., Bertone P., Gerstein M., Snyder M., Yu H., Bertone P., Gerstein M., Snyder M., Bertone P., Gerstein M., Snyder M., Gerstein M., Snyder M., Snyder M. Target hub proteins serve as master regulators of development in yeast. Genes & Dev. 2006;20:435–448. - PMC - PubMed

Publication types

Associated data